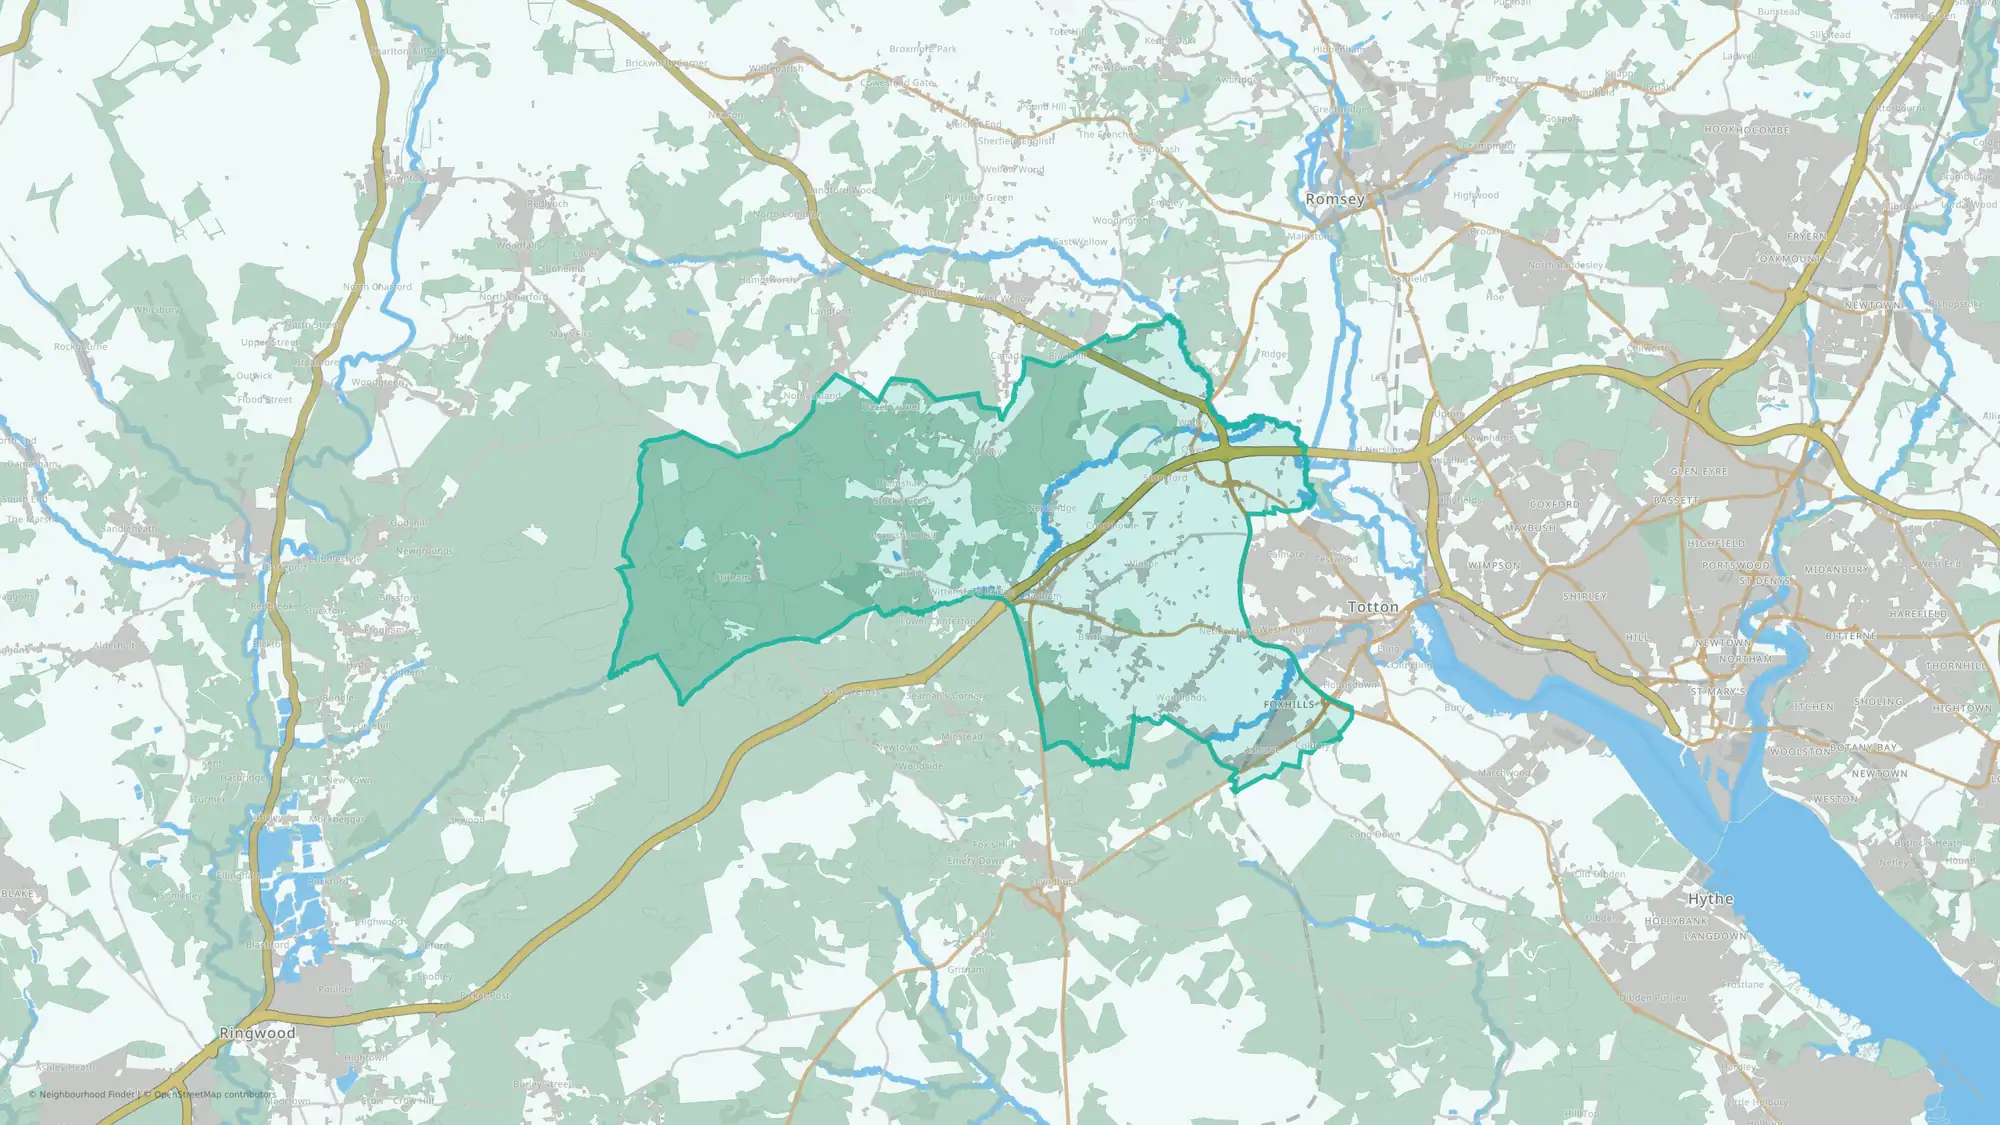
Ashurst, Bramshaw, Copythorne & Netley Marsh
safety may need closer review
This public area guide compares Ashurst, Bramshaw, Copythorne & Netley Marsh in New Forest using available headline data on crime, house prices, schools, flood risk and transport.
Is Ashurst, Bramshaw, Copythorne & Netley Marsh a good place to live?
Ashurst, Bramshaw, Copythorne & Netley Marsh has a mixed public data profile, so whether it is a good fit depends on which factors matter most to you. Crime data appears weaker and house prices appear higher than many neighbourhoods nationally, so those factors are worth checking against your priorities.
You can also compare nearby neighbourhoods in New Forest below.
For the full breakdown, open the app report for deeper comparisons and shortlist tools.
Ashurst, Bramshaw, Copythorne & Netley Marsh at a glance
Best fit and trade-offs
May suit
The public data shows a mixed profile, so the right fit depends on your priorities.
No additional grounded may-suit bullets are available.
Watch out for
- Crime data appears weaker than many neighbourhoods nationally
- House prices appear higher than many neighbourhoods nationally
Crime rate in Ashurst, Bramshaw, Copythorne & Netley Marsh
Crime rate
Crime rate
19.54 per 1,000 people
Percentile
24th percentile nationally
Crime data appears weaker than most neighbourhoods nationally.
House prices in Ashurst, Bramshaw, Copythorne & Netley Marsh
House prices
Average sold price
£645,853
Percentile
96th percentile nationally
House prices appear higher than many neighbourhoods nationally.
Schools in Ashurst, Bramshaw, Copythorne & Netley Marsh
Flood risk in Ashurst, Bramshaw, Copythorne & Netley Marsh
Transport in Ashurst, Bramshaw, Copythorne & Netley Marsh
What the full report adds
This public guide covers headline signals for crime, house prices, schools, flood risk and transport. The full report adds deeper lifestyle, health, green space, family and local life data, plus tools to compare and shortlist neighbourhoods.
FAQs
Is Ashurst, Bramshaw, Copythorne & Netley Marsh a good place to live?
Ashurst, Bramshaw, Copythorne & Netley Marsh has a mixed public data profile, so whether it is a good fit depends on which factors matter most to you. Crime data appears weaker and house prices appear higher than many neighbourhoods nationally, so those factors are worth checking against your priorities.
Is Ashurst, Bramshaw, Copythorne & Netley Marsh safe?
Ashurst, Bramshaw, Copythorne & Netley Marsh ranks in the 24th percentile for crime data; in this dataset, a higher percentile indicates lower crime.
What are house prices like in Ashurst, Bramshaw, Copythorne & Netley Marsh?
The average sold price is £645,853, with house prices in the 96th percentile nationally.
How are schools in Ashurst, Bramshaw, Copythorne & Netley Marsh?
Schools rank in the 67th percentile nationally for this public profile.
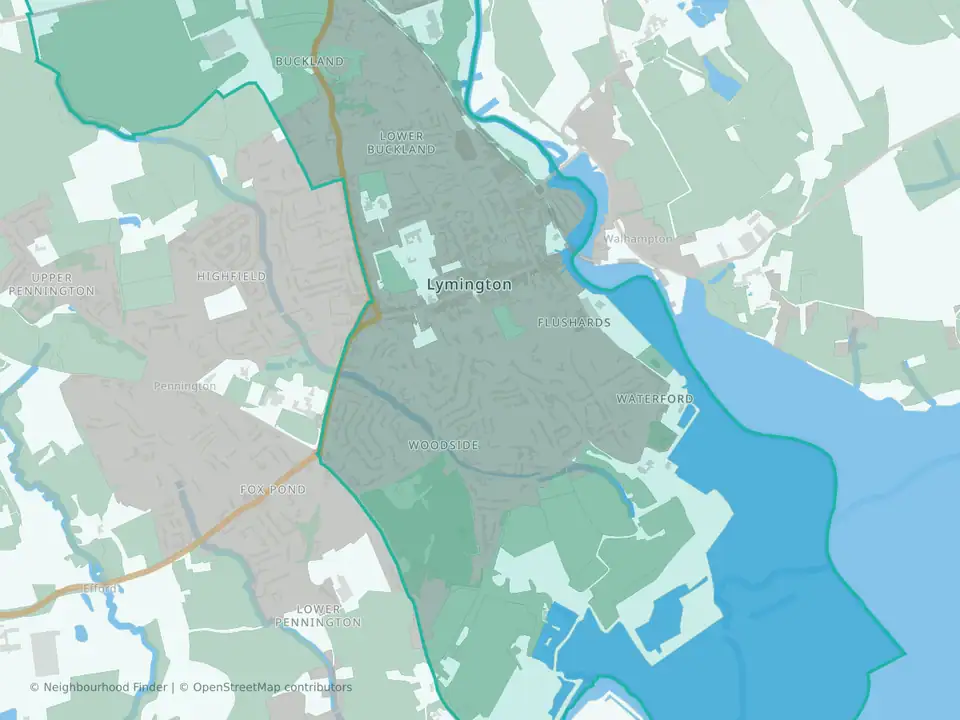
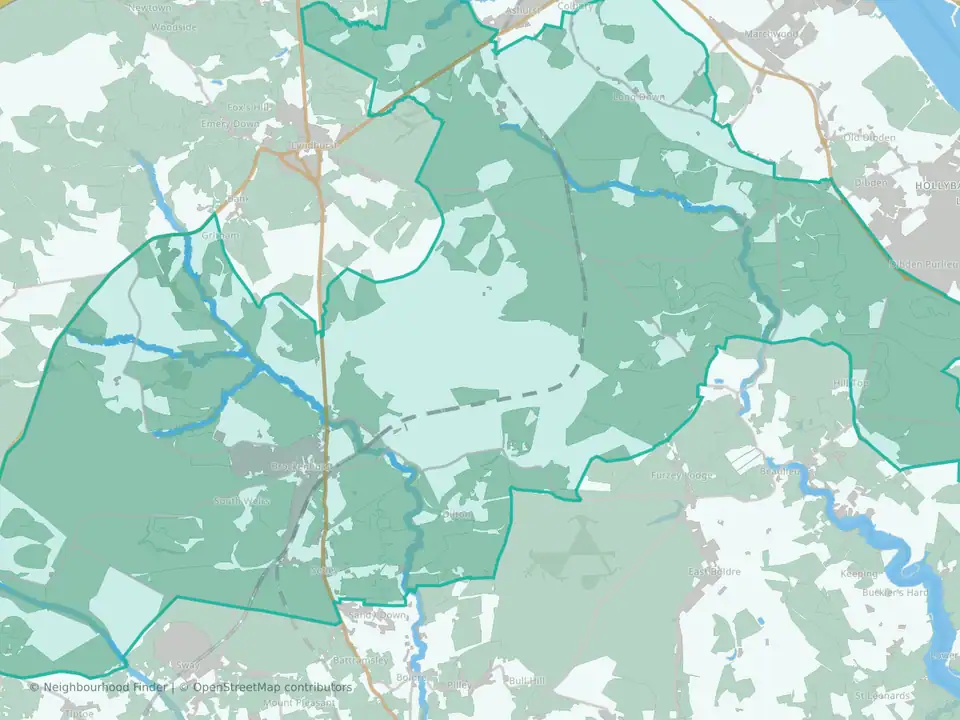
What neighbourhoods are near Ashurst, Bramshaw, Copythorne & Netley Marsh?
Nearby public profiles include Lymington in New Forest and Brockenhurst & Denny Lodge in New Forest.