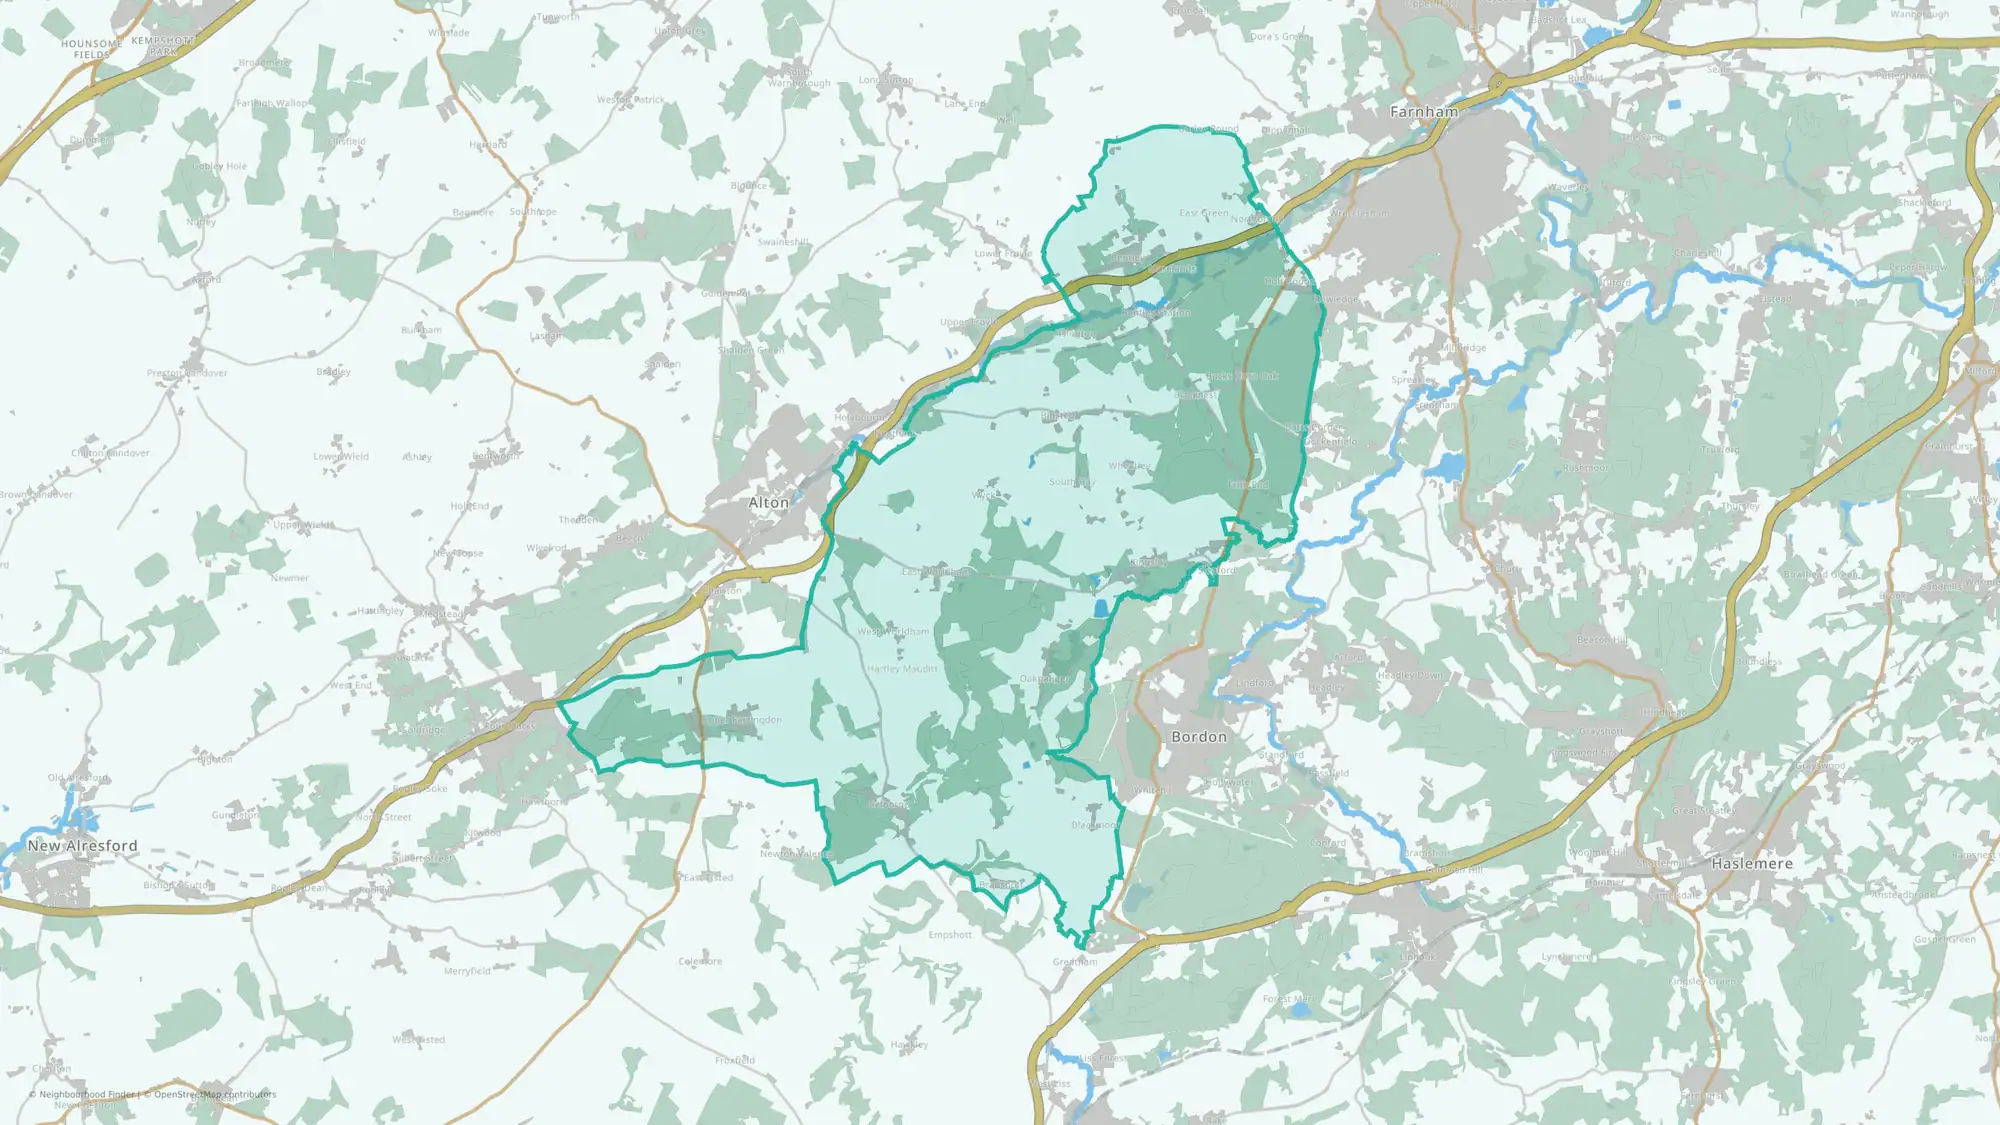
Binsted, Bentley & Selborne
Strong on schools, weaker on transport
This public area guide compares Binsted, Bentley & Selborne in East Hampshire using available headline data on crime, house prices, schools, flood risk and transport.
Is Binsted, Bentley & Selborne a good place to live?
Binsted, Bentley & Selborne may be a good fit for people who value stronger school performance. It ranks strongly for stronger school performance, while flood risk is around the national middle range. Transport access appears weaker and house prices appear higher than many neighbourhoods nationally, so those factors are worth checking against your priorities.
You can also compare nearby neighbourhoods in East Hampshire below.
For the full breakdown, open the app report for deeper comparisons and shortlist tools.
Binsted, Bentley & Selborne at a glance
Best fit and trade-offs
May suit
- Families who care about school performance
Watch out for
- Transport access appears weaker than most neighbourhoods nationally
- House prices appear higher than many neighbourhoods nationally
Crime rate in Binsted, Bentley & Selborne
Crime rate
Crime rate
12.22 per 1,000 people
Percentile
70th percentile nationally
Crime data is above the national middle range.
House prices in Binsted, Bentley & Selborne
House prices
Average sold price
£743,527
Percentile
98th percentile nationally
House prices appear higher than many neighbourhoods nationally.
Schools in Binsted, Bentley & Selborne
Flood risk in Binsted, Bentley & Selborne
Transport in Binsted, Bentley & Selborne
What the full report adds
This public guide covers headline signals for crime, house prices, schools, flood risk and transport. The full report adds deeper lifestyle, health, green space, family and local life data, plus tools to compare and shortlist neighbourhoods.
FAQs
Is Binsted, Bentley & Selborne a good place to live?
Binsted, Bentley & Selborne may be a good fit for people who value stronger school performance. It ranks strongly for stronger school performance, while flood risk is around the national middle range. Transport access appears weaker and house prices appear higher than many neighbourhoods nationally, so those factors are worth checking against your priorities.
Is Binsted, Bentley & Selborne safe?
Binsted, Bentley & Selborne ranks in the 70th percentile for crime data; in this dataset, a higher percentile indicates lower crime.
What are house prices like in Binsted, Bentley & Selborne?
The average sold price is £743,527, with house prices in the 98th percentile nationally.
How are schools in Binsted, Bentley & Selborne?
Schools rank in the 94th percentile nationally for this public profile.
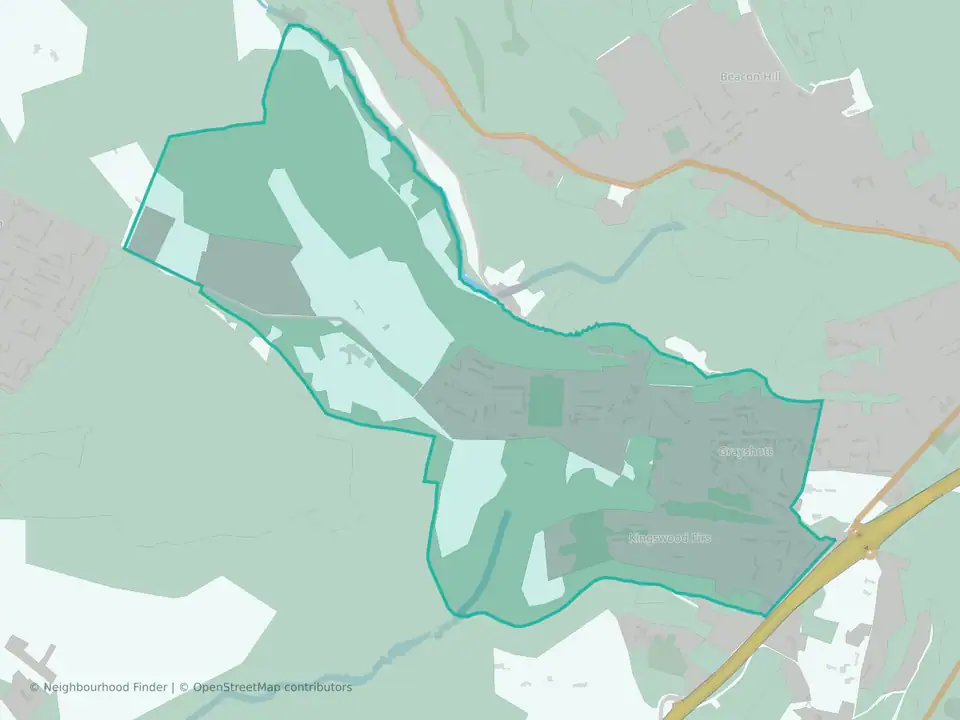
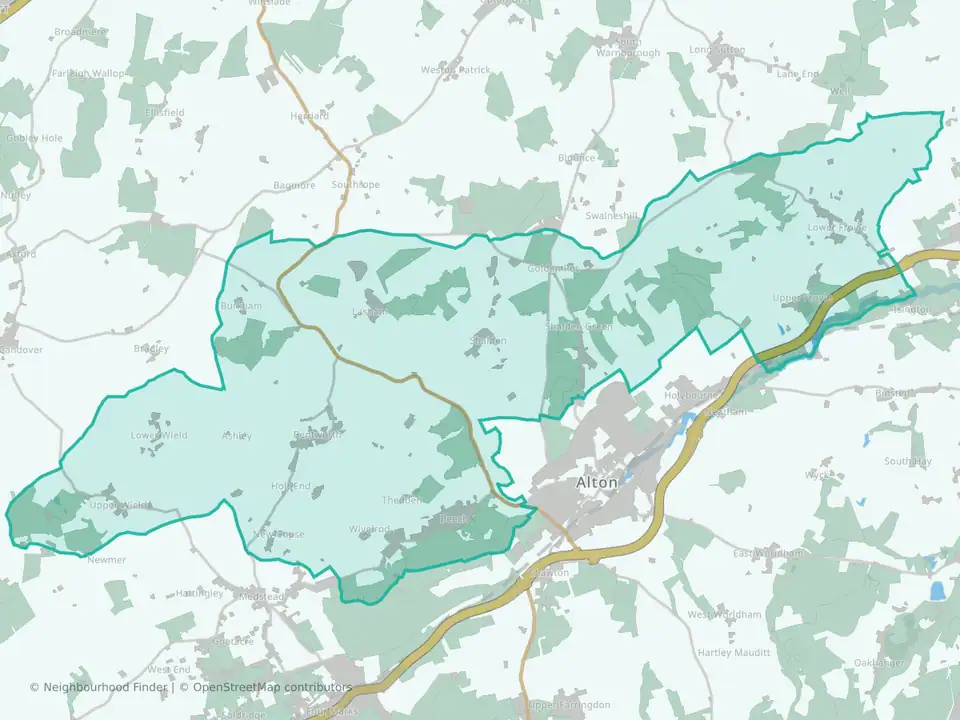
What neighbourhoods are near Binsted, Bentley & Selborne?
Nearby public profiles include Grayshott in East Hampshire and Bentworth & Froyle in East Hampshire.