A new-town township on the western side of Peterborough, cheaper than the Peterborough average, with recorded crime above the city rate
Bretton at a glance
- House prices
- £195,000
- Lower prices18th percentile
- Schools
- 24th percentile
- Weak
- Transport
- 29th percentile
- Weak
- Crime rate
- 139.1 per 1,000 residents
- Weak11th percentile
- Flood risk
- 2.2% of the area in flood zones
- Less flood-zone land29th percentile
Underlying data dates vary by measure.
How to read these figuresIs Bretton a good place to live?
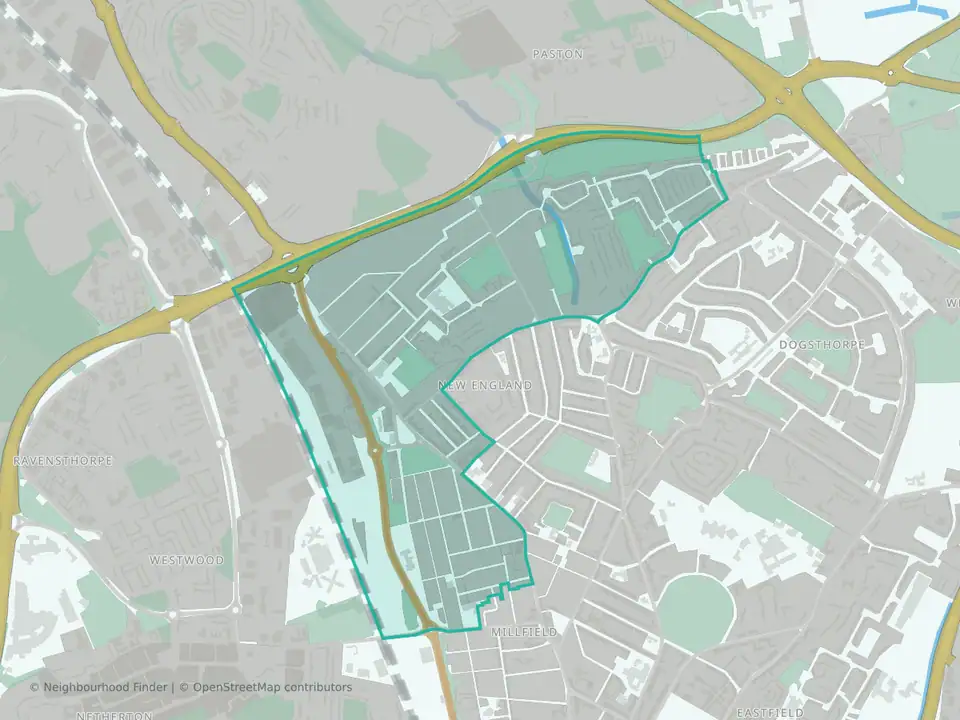
Bretton is a township on the western side of Peterborough, built as part of the new town. Terraced homes made up more than half of sales. Homes cost less than across the city: the median sale price was £195,000 in the 12 months to August 2026, against £240,000 across Peterborough and £295,000 across England.
Recorded crime is above the Peterborough and England rates: police recorded 139 crimes and anti-social behaviour incidents per 1,000 residents over the same 12 months, against 123 across Peterborough and 94 across England. Only 3 of Peterborough's 25 areas record more. Theft, at 42 per 1,000, is more than twice the England rate.
There is no railway station in the ward; Peterborough station is about 2.1 miles from its centre. Werrington, next door, records less crime but costs more; Orton Longueville records less crime and costs about the same.
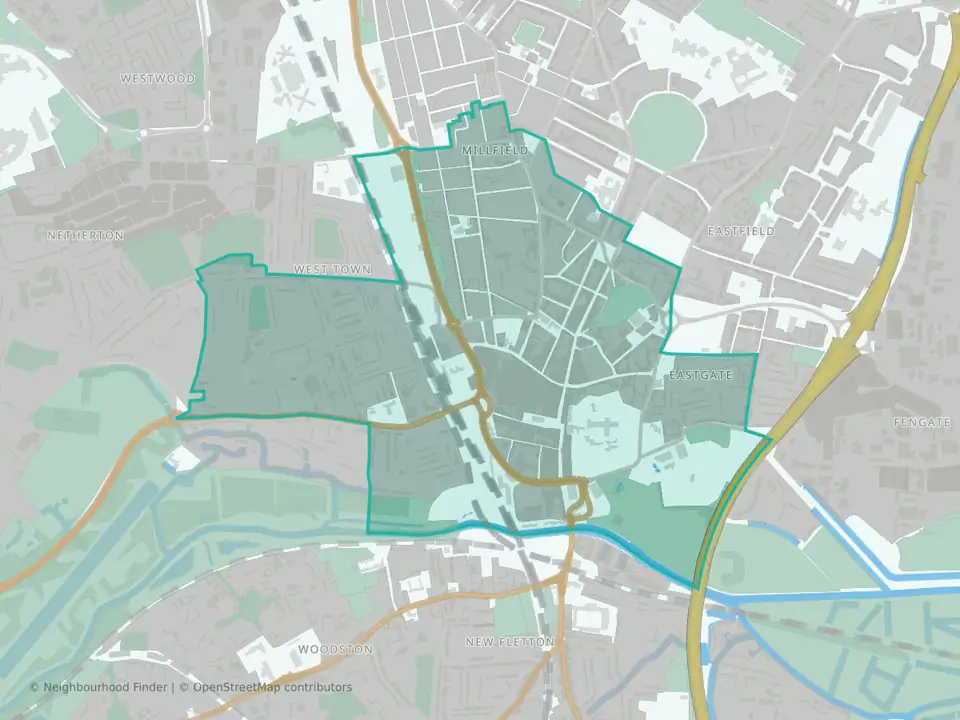
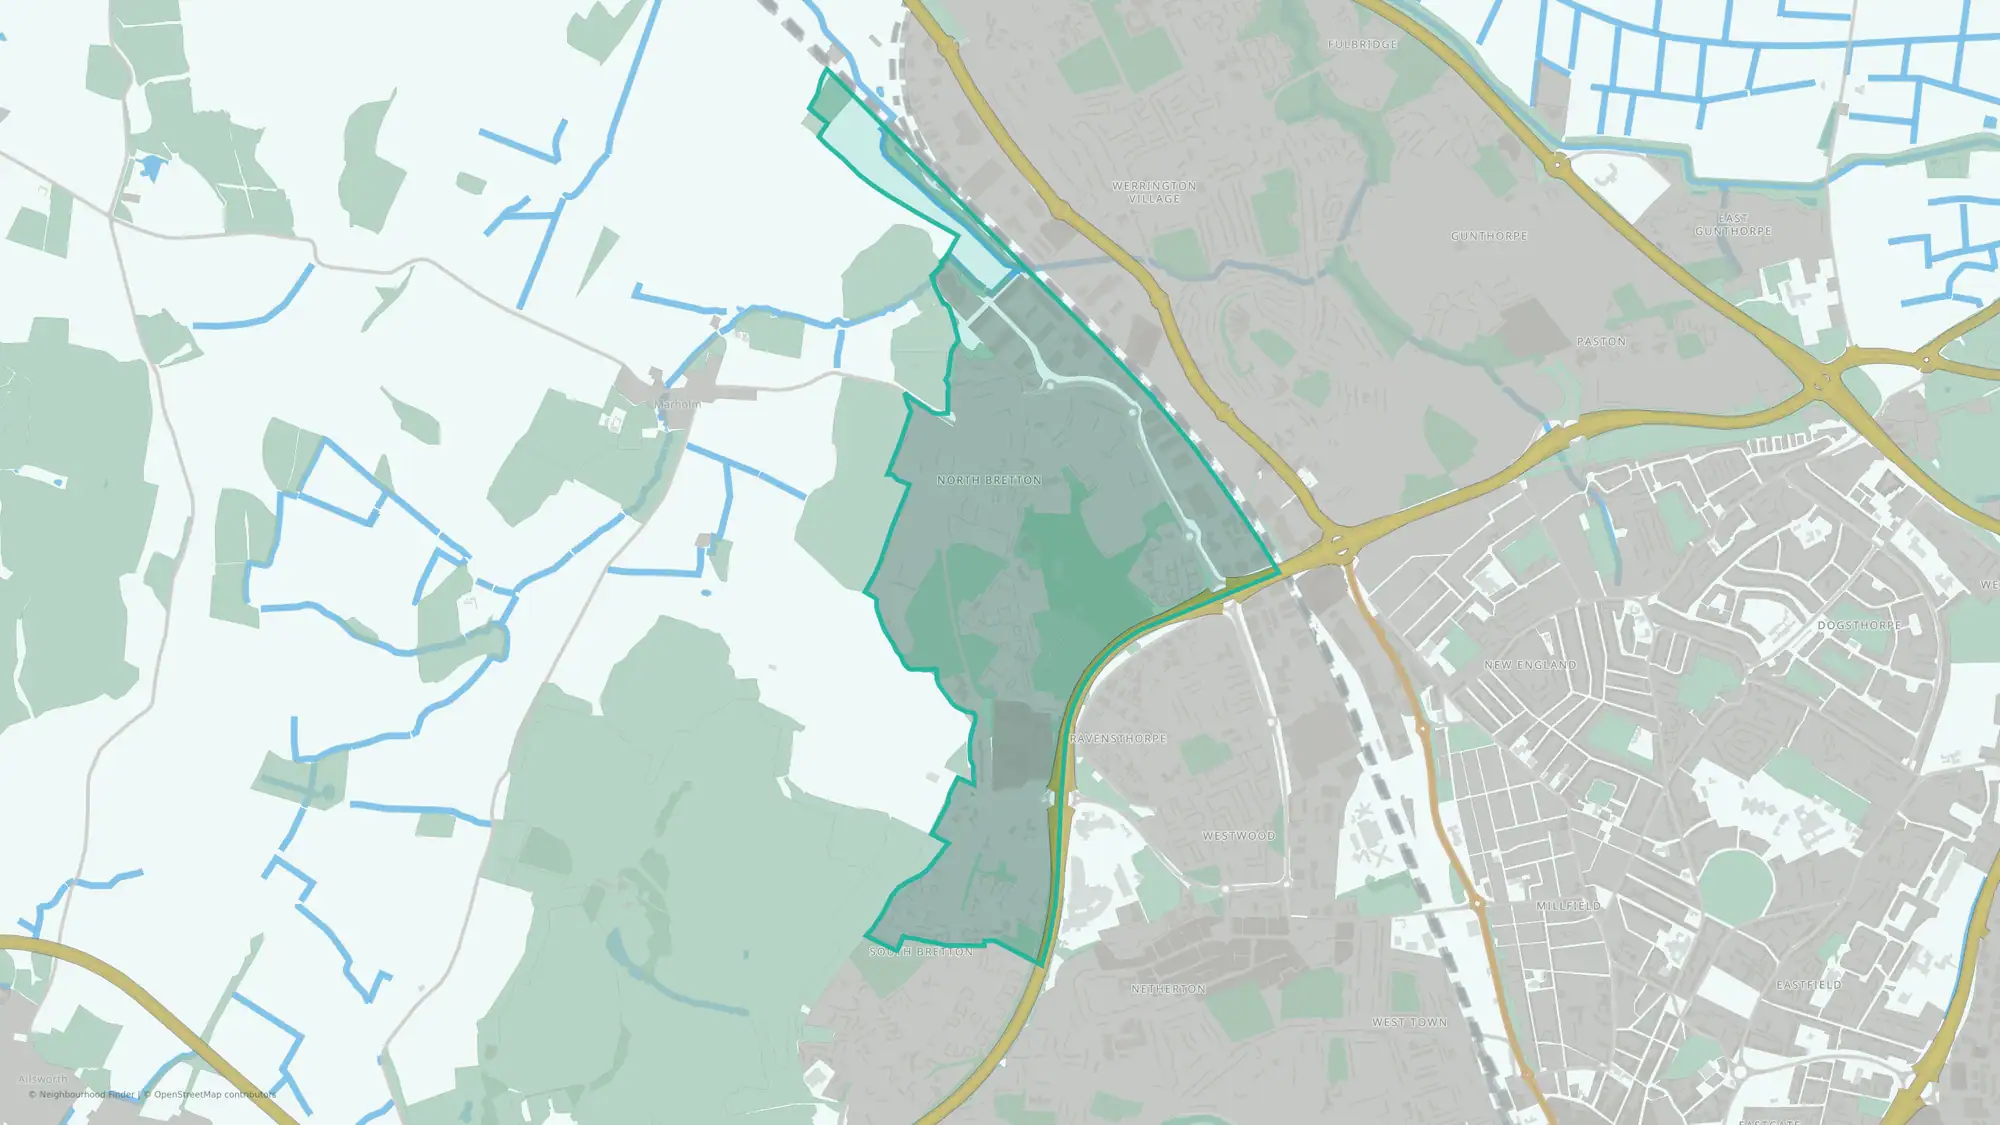
This guide covers Bretton ward: 6 small census areas, 3.1 square kilometres and 10,530 residents at the 2021 Census.
You can also compare nearby neighbourhoods in City of Peterborough below.
How Bretton compares
| Area | Crime and ASB per 1,000 | Violence and sexual offences per 1,000 | Theft per 1,000 | Median sale price |
|---|---|---|---|---|
| Bretton | 139.1 | 52.0 | 41.8 | £195,000 (56) |
| Werrington | 88.0 | 25.0 | 20.8 | £258,000 (97) |
| Orton Longueville | 88.3 | 41.3 | 5.6 | £187,000 (61) |
| City of Peterborough | 123.4 | 50.7 | 19.1 | £240,000 (1,502) |
| England | 94.1 | 35.9 | 18.1 | £295,000 (502,418) |
In the same 12 months, terraced homes in Bretton sold for a median of £189,500 (30 sales) and semi-detached homes for £212,000 (15). Too few detached homes or flats sold for a reliable figure.
What to check before you move
- Look at the street, not just the ward. police.uk maps recorded crime month by month, so you can see whether incidents cluster in particular places or near the home you are considering.
- Try the journey at the times you would travel. There is no railway station in the ward; Peterborough station is about 2.1 miles from its centre, and our data does not include bus frequencies.
- Check the flood map for the specific property. Small parts of the ward are in flood zones 2 or 3, and surface-water risk is mapped separately.
- Check school places directly. Four primary schools are inside the ward but no secondary school; read the latest Ofsted reports and Peterborough City Council's admission rules, because living nearby does not guarantee a place.
Areas to compare with Bretton
Werrington
City of Peterborough
Neighbouring area to the north, with lower recorded crime (88 per 1,000) and a higher median sale price, £258,000.
Read the Werrington guideOrton Longueville
City of Peterborough
About 3.1 miles south, with lower recorded crime (88 per 1,000) and a similar median sale price, £187,000.
Read the Orton Longueville guideSources: police.uk recorded crime (September 2025 to August 2026); ONS 2021 Census population; HM Land Registry Price Paid Data (September 2025 to August 2026); Environment Agency flood zones; NaPTAN station locations; Ofsted school register. Updated 4 November 2026.
Best fit and trade-offs
May suit
- Buyers looking for lower house prices
Watch out for
- Transport access appears weaker than most neighbourhoods nationally
- School performance appears weaker than many neighbourhoods nationally
- Crime data appears weaker than many neighbourhoods nationally
Crime rate in Bretton
Crime rate
- Crime rate
- 139.1 per 1,000 residents
- Percentile
- 11th percentile nationally
Recorded crime is higher than in most neighbourhoods nationally.
Recorded crimes and anti-social behaviour per 1,000 residents over the 12 months to August 2026. Higher crime percentiles indicate lower recorded crime. Busy centres can show high rates because crimes are counted where they happen but divided by the people who live there.
House prices in Bretton
House prices
- Median sale price
- £195,000
- Percentile
- 18th percentile nationally
House prices appear lower than many neighbourhoods nationally.
Median of 56 standard sales over the 12 months to August 2026, from HM Land Registry. Lower price percentiles indicate lower prices nationally. This is an area figure, not a valuation of a particular home.
Crime by type in Bretton
Recorded crime by type
The largest recorded type in Bretton is violence, sexual offences and weapons, at 52.0 per 1,000 residents: close to City of Peterborough (50.7) and higher than England (35.9).
| Type | Bretton | City of Peterborough | England |
|---|---|---|---|
| Violence, sexual offences and weapons | 52.0 | 50.7 | 35.9 |
| Theft, including shoplifting | 41.8 | 19.1 | 18.1 |
| Anti-social behaviour | 13.8 | 15.8 | 10.7 |
| Public order | 9.0 | 7.7 | 6.6 |
| Criminal damage and arson | 7.6 | 9.9 | 6.8 |
| Vehicle crime | 4.7 | 5.5 | 5.3 |
| Burglary | 4.4 | 4.2 | 3.7 |
| Other crime | 2.8 | 3.9 | 2.2 |
| Drugs | 2.2 | 5.5 | 3.4 |
| Robbery | 0.9 | 1.1 | 1.5 |
Recorded crime is not the same as personal risk. How to read crime figures for an area · Check another area
Schools in Bretton
Schools
24th percentile nationally
Higher percentiles indicate stronger schools indicators nationally.
Flood risk in Bretton
Flood risk
2.2% of the area in flood zones 2 or 3
Land in Environment Agency river and sea flood zones 2 or 3. Zone 3, the higher-probability zone, covers 0.2% of the area. That is the 29th percentile among neighbourhoods in England, where higher means more flood-zone land. Surface water is not included, and this is not an address-level assessment: check the flood map for the specific property.
Transport in Bretton
Transport
29th percentile nationally
Higher percentiles indicate stronger transport indicators nationally.
FAQs
Is Bretton, Peterborough a good place to live?
It depends on what you are prioritising. In Bretton, homes cost less than across the city, with a median sale price of £195,000 in the year to August 2026, but the ward records more crime than Peterborough as a whole, and there is no railway station in the ward.
Is Bretton safe?
Police recorded 139 crimes and anti-social behaviour incidents per 1,000 residents in the 12 months to August 2026, compared with 123 across Peterborough and 94 across England. Theft is more than twice the England rate. Recorded crime is not the same as personal risk, so check police.uk for the streets you are considering.
What are house prices like in Bretton?
Homes sold for a median of £195,000 in the 12 months to August 2026, across 56 standard sales. Terraced homes sold for a median of £189,500 and semi-detached homes for £212,000. Too few detached homes or flats sold for a reliable figure.
Is Bretton a good place to live?
Bretton may be a good fit for people who value lower house prices. Transport access appears weaker and school performance appears weaker, so those factors are worth checking against your priorities.
How are schools in Bretton?
Schools rank in the 24th percentile nationally for this public profile.
What neighbourhoods are near Bretton?
Nearby public profiles include North in City of Peterborough and Central in City of Peterborough.