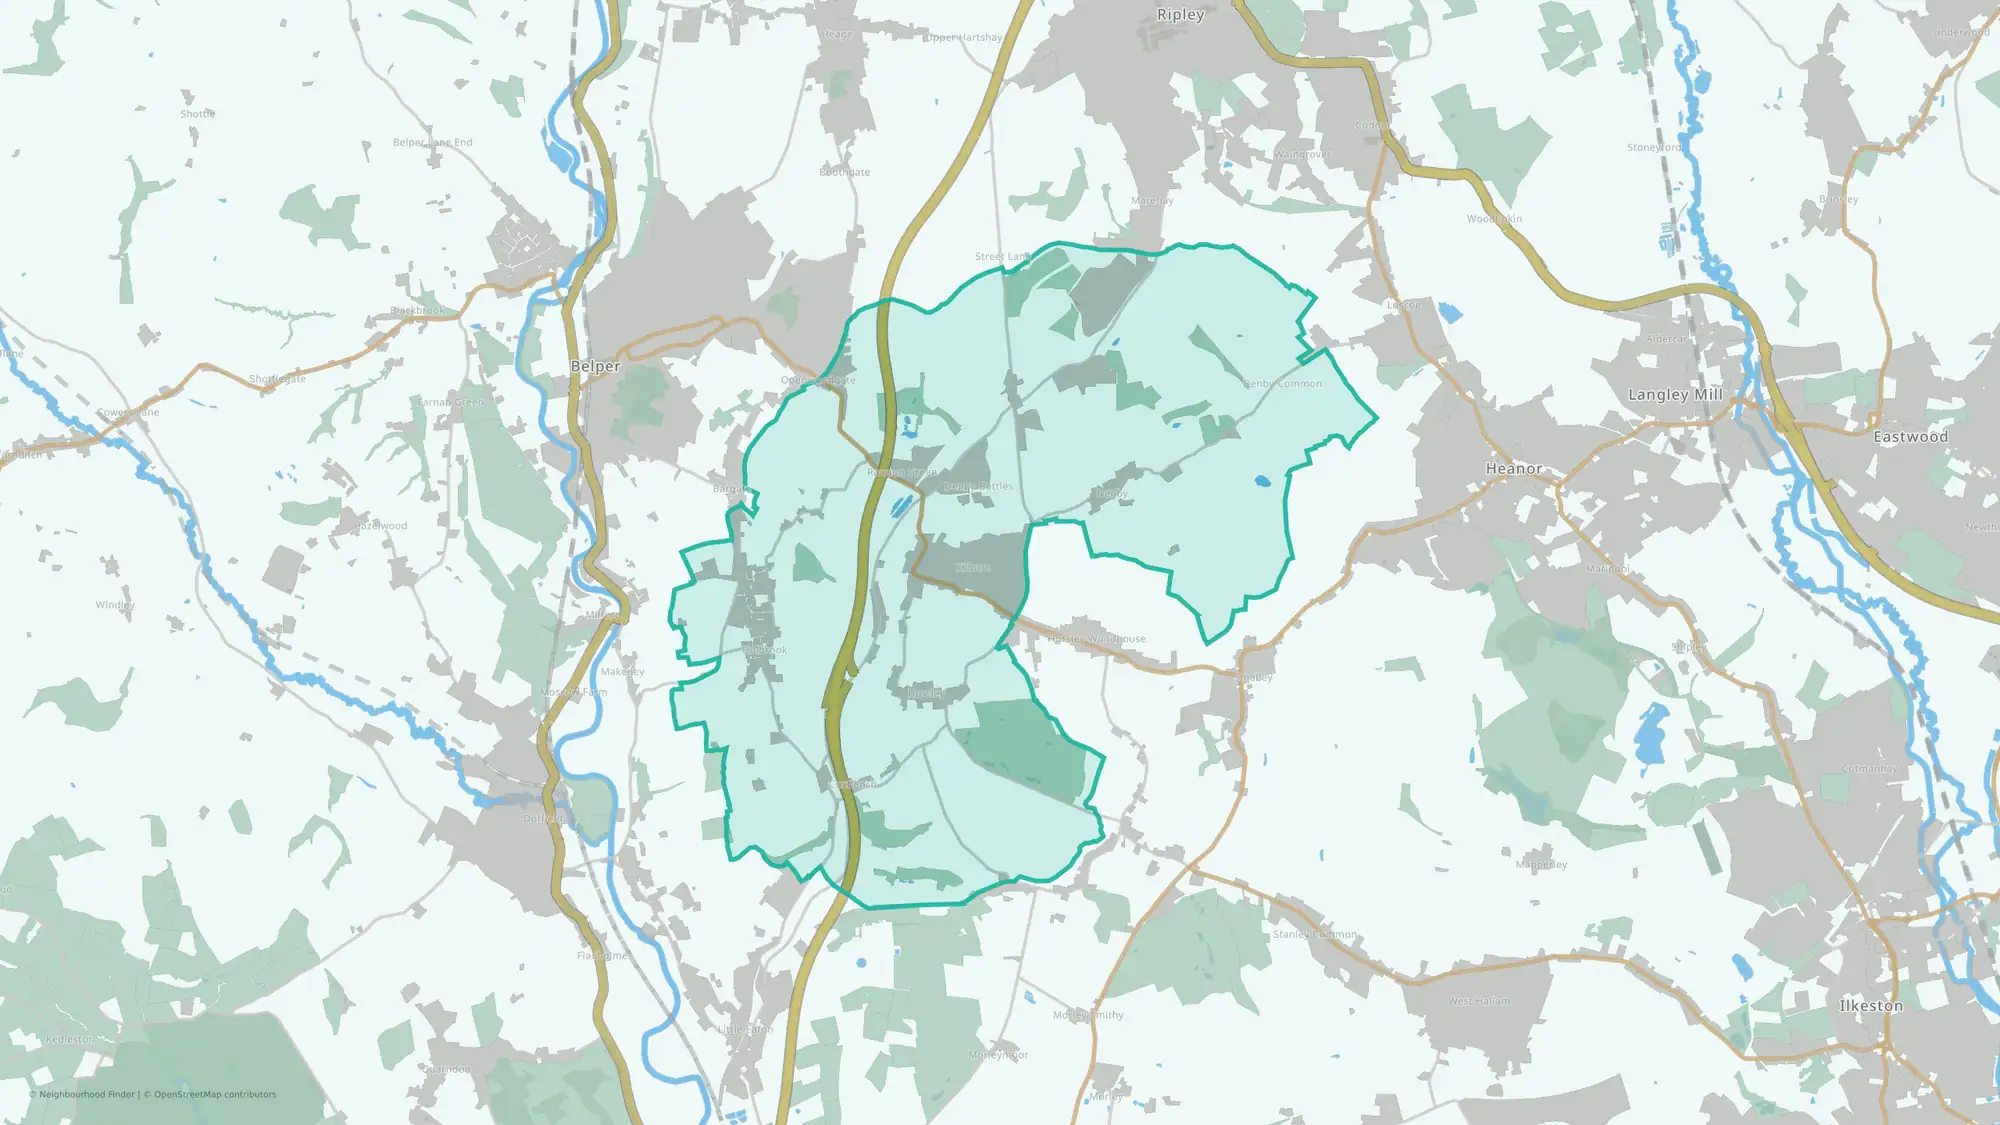
Kilburn, Denby, Holbrook & Horsley
Strong on safety, weaker on lower house prices
This public area guide compares Kilburn, Denby, Holbrook & Horsley in Amber Valley using available headline data on crime, house prices, schools, flood risk and transport.
Is Kilburn, Denby, Holbrook & Horsley a good place to live?
Kilburn, Denby, Holbrook & Horsley may be a good fit for people who value lower crime and lower house prices. It ranks strongly for lower crime and lower house prices, while flood risk is around the national middle range and schools are around the national middle range. The public data does not show a single obvious weak signal among the available headline measures.
You can also compare nearby neighbourhoods in Amber Valley below.
For the full breakdown, open the app report for deeper comparisons and shortlist tools.
Kilburn, Denby, Holbrook & Horsley at a glance
Best fit and trade-offs
May suit
- People prioritising lower crime
- Buyers looking for lower house prices
Watch out for
The public data shows a mixed profile, so the right fit depends on your priorities.
No additional grounded watch-out bullets are available.
Crime rate in Kilburn, Denby, Holbrook & Horsley
Crime rate
Crime rate
10.67 per 1,000 people
Percentile
81st percentile nationally
Lower crime than most neighbourhoods nationally.
House prices in Kilburn, Denby, Holbrook & Horsley
House prices
Average sold price
£204,319
Percentile
22nd percentile nationally
House prices appear lower than many neighbourhoods nationally.
Schools in Kilburn, Denby, Holbrook & Horsley
Flood risk in Kilburn, Denby, Holbrook & Horsley
Transport in Kilburn, Denby, Holbrook & Horsley
What the full report adds
This public guide covers headline signals for crime, house prices, schools, flood risk and transport. The full report adds deeper lifestyle, health, green space, family and local life data, plus tools to compare and shortlist neighbourhoods.
FAQs
Is Kilburn, Denby, Holbrook & Horsley a good place to live?
Kilburn, Denby, Holbrook & Horsley may be a good fit for people who value lower crime and lower house prices. It ranks strongly for lower crime and lower house prices, while flood risk is around the national middle range and schools are around the national middle range. The public data does not show a single obvious weak signal among the available headline measures.
Is Kilburn, Denby, Holbrook & Horsley safe?
Kilburn, Denby, Holbrook & Horsley ranks in the 81st percentile for crime data; in this dataset, a higher percentile indicates lower crime.
What are house prices like in Kilburn, Denby, Holbrook & Horsley?
The average sold price is £204,319, with house prices in the 22nd percentile nationally.
How are schools in Kilburn, Denby, Holbrook & Horsley?
Schools rank in the 42nd percentile nationally for this public profile.
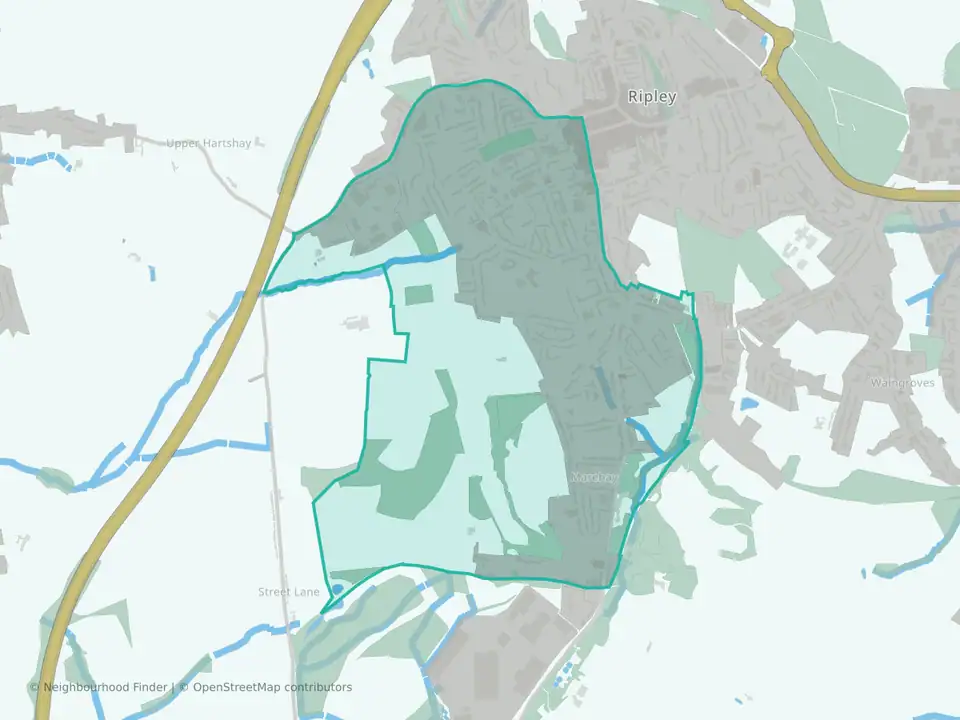
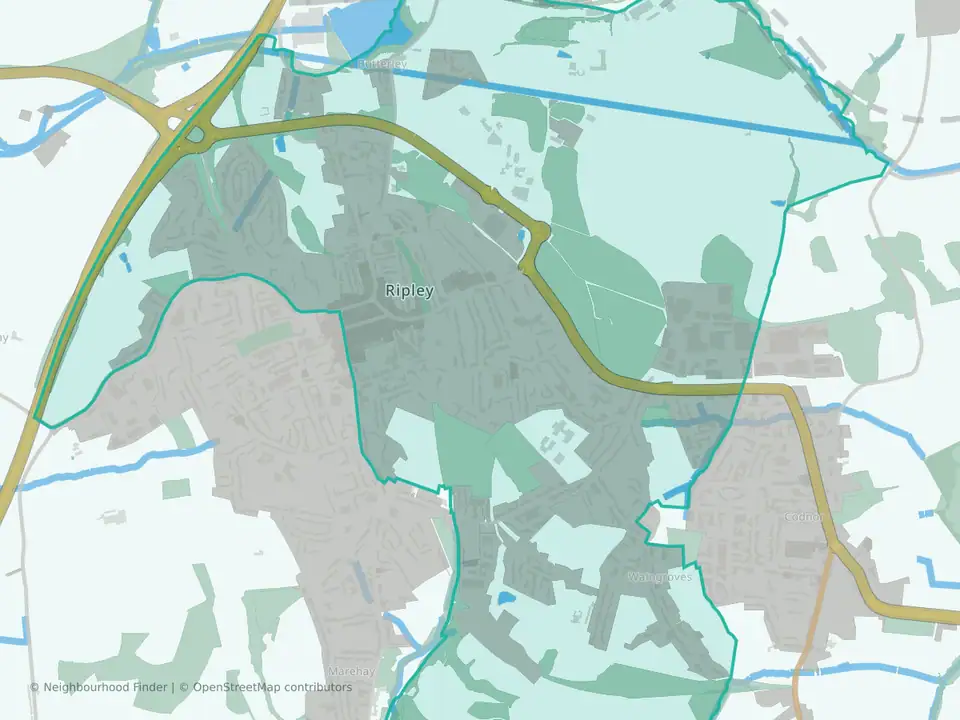
What neighbourhoods are near Kilburn, Denby, Holbrook & Horsley?
Nearby public profiles include Ripley & Marehay in Amber Valley and Ripley in Amber Valley.