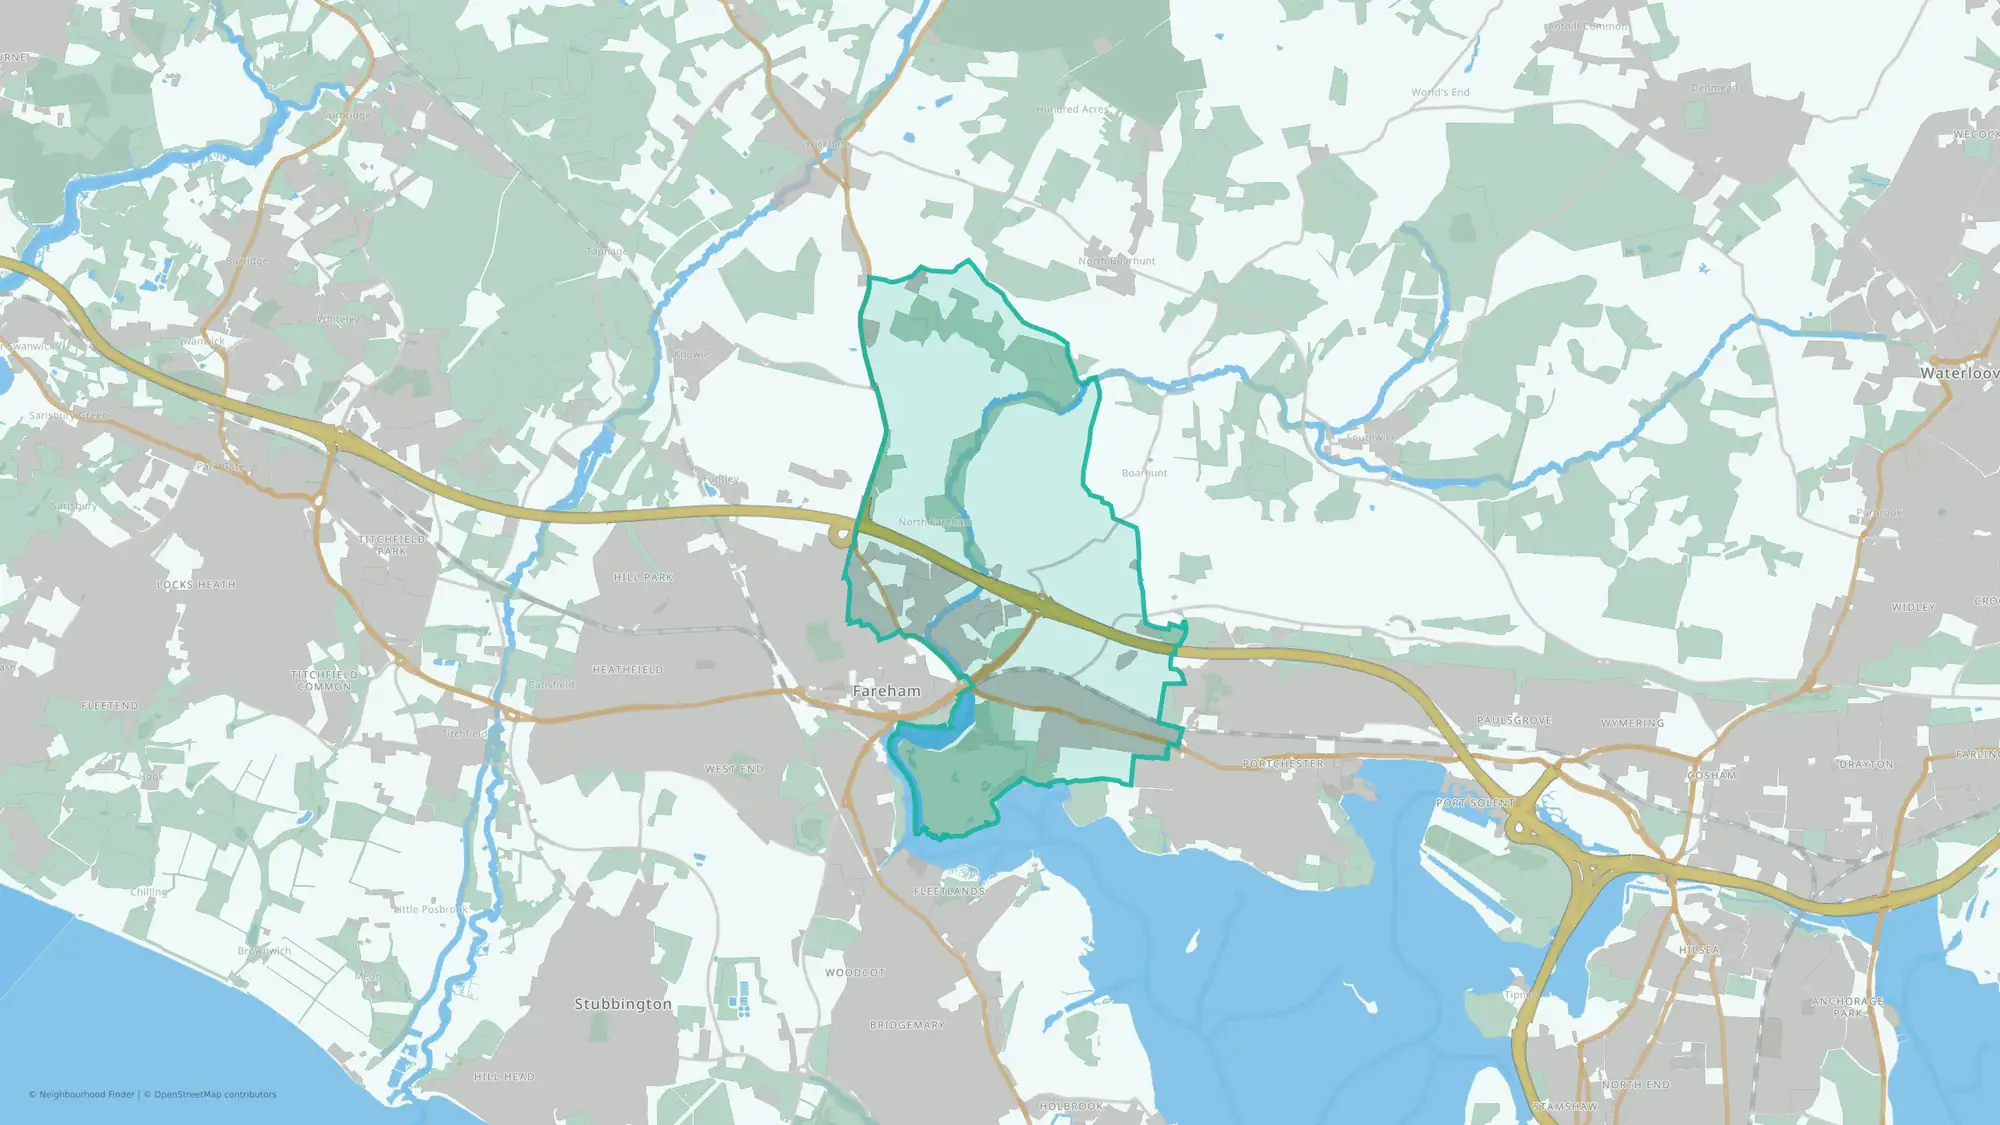
Wallington & Downend neighbourhood data at a glance
This public area guide compares Wallington & Downend in Fareham using available headline data on crime, house prices, schools, flood risk and transport.
Is Wallington & Downend a good place to live?
Wallington & Downend has a mixed public data profile, so whether it is a good fit depends on which factors matter most to you. The public data does not show a single obvious weak signal among the available headline measures.
You can also compare nearby neighbourhoods in Fareham below.
For the full breakdown, open the app report for deeper comparisons and shortlist tools.
Wallington & Downend at a glance
Best fit and trade-offs
May suit
The public data shows a mixed profile, so the right fit depends on your priorities.
No additional grounded may-suit bullets are available.
Watch out for
The public data shows a mixed profile, so the right fit depends on your priorities.
No additional grounded watch-out bullets are available.
Crime rate in Wallington & Downend
Crime rate
Crime rate
14.72 per 1,000 people
Percentile
52nd percentile nationally
Crime levels are around the national middle range.
House prices in Wallington & Downend
House prices
Average sold price
£294,584
Percentile
50th percentile nationally
House prices are around the national middle range.
Schools in Wallington & Downend
Flood risk in Wallington & Downend
Transport in Wallington & Downend
What the full report adds
This public guide covers headline signals for crime, house prices, schools, flood risk and transport. The full report adds deeper lifestyle, health, green space, family and local life data, plus tools to compare and shortlist neighbourhoods.
FAQs
Is Wallington & Downend a good place to live?
Wallington & Downend has a mixed public data profile, so whether it is a good fit depends on which factors matter most to you. The public data does not show a single obvious weak signal among the available headline measures.
Is Wallington & Downend safe?
Wallington & Downend ranks in the 52nd percentile for crime data; in this dataset, a higher percentile indicates lower crime.
What are house prices like in Wallington & Downend?
The average sold price is £294,584, with house prices in the 50th percentile nationally.
How are schools in Wallington & Downend?
Schools rank in the 53rd percentile nationally for this public profile.
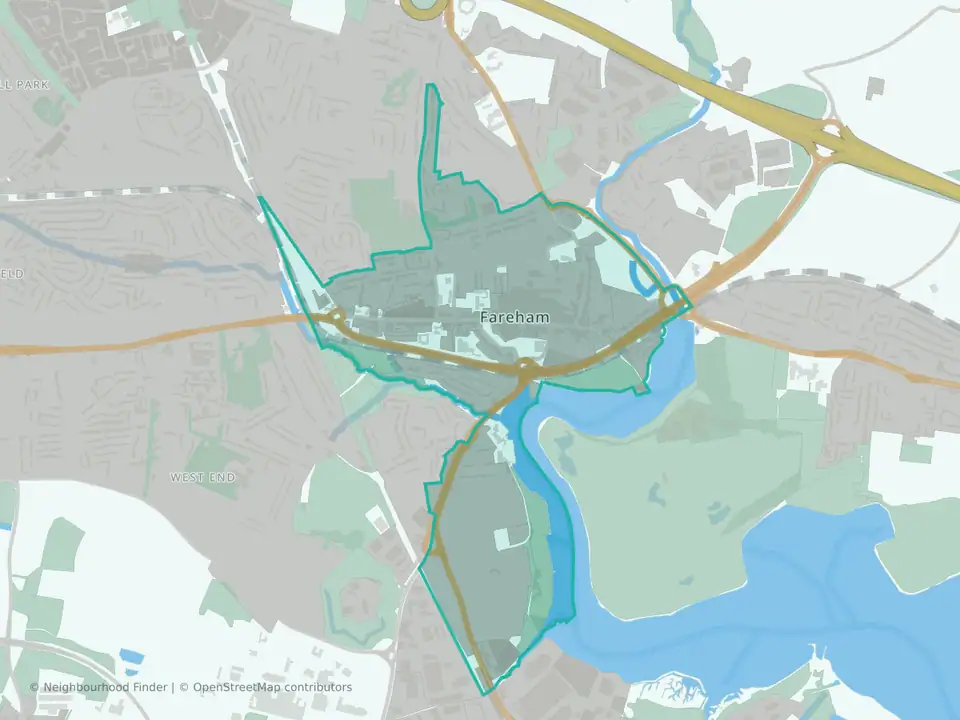
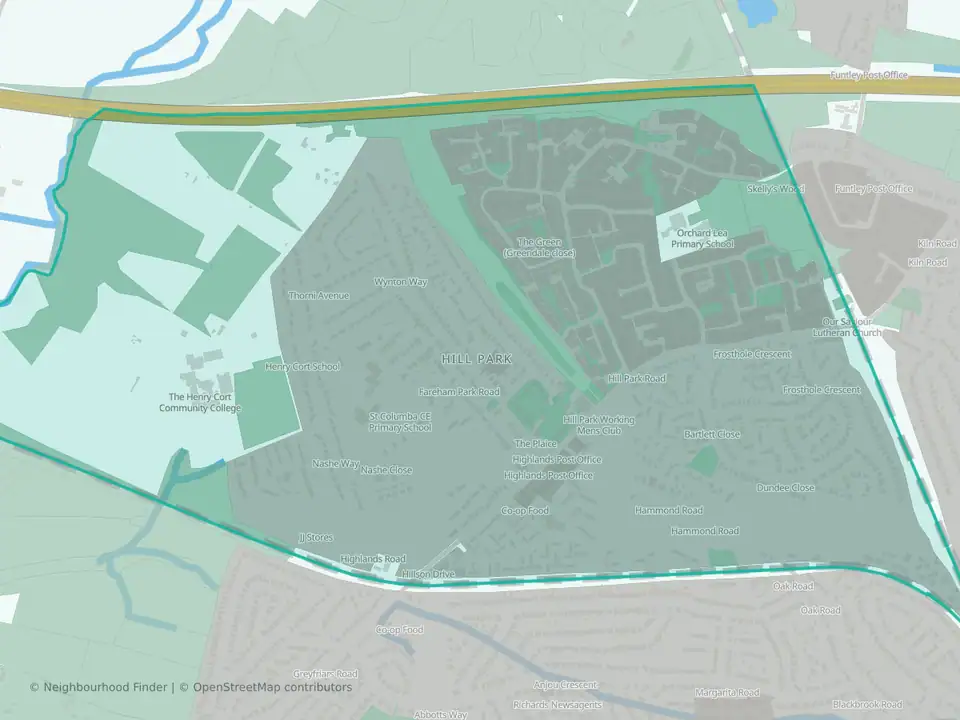
What neighbourhoods are near Wallington & Downend?
Nearby public profiles include Fareham Town in Fareham and Fareham Park in Fareham.