Middlesbrough's lower house prices now come with a sharper reported-crime trade-off
Neighbourhood Finder analysis shows Middlesbrough's latest average house price was 33.6% below the North Yorkshire local-authority median, while its reported-crime rate rose by 12.7 per 1,000 residents over the six-month comparison.
- Latest period
- March 2026
- Neighbourhood rows
- 20
- Price coverage shown
- LSOA counts and %
The story
Lower prices may widen choice, but the latest reported-crime movement makes the shortlist harder
Middlesbrough remains one of the lower-priced local housing markets in North Yorkshire, but the latest Neighbourhood Finder analysis suggests the choice facing movers is not just about price.
In the March 2026 authority dataset, Middlesbrough's population-weighted average house price was about GBP149,000. That was 33.6% below the North Yorkshire local-authority median of about GBP225,000.
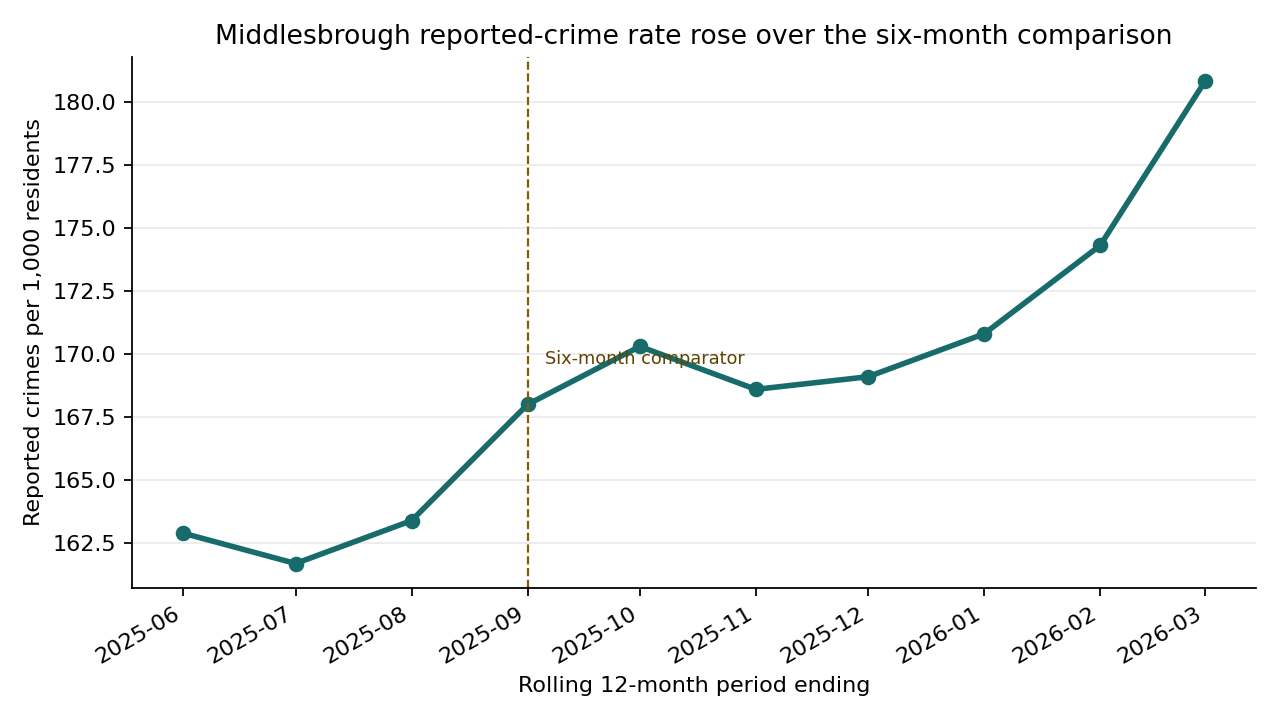
Over the same six-month comparison window, Middlesbrough's reported-crime rate rose from 168.0 to 180.8 per 1,000 residents. That is an increase of 12.7 per 1,000 residents between September 2025 and March 2026.
The finding does not mean lower prices are caused by reported crime, or that any area should be judged on one metric. It does mean that buyers, renters, and residents comparing Middlesbrough neighbourhoods may need to look beyond the headline price point.
For a household shortlisting places to live, the useful question is whether a lower price still fits the everyday trade-offs they are willing to make. Reported crime is only one indicator, but a rising indicator can change how simple an affordability story feels.
Neighbourhood-level figures show why the trade-off needs checking locally rather than treated as one town-wide judgement. Central sat well above the town-wide reported-crime rate in the latest table, while areas such as Marton West and Nunthorpe sat much lower. The table shows the exact price LSOA coverage behind each neighbourhood price figure, so readers can see where the price signal is complete and where it is more directional.
The table below is provided so readers can compare named neighbourhoods without presenting them as a best-or-worst ranking.
Average price
GBP149k
Middlesbrough weighted average, March 2026
Price comparator
33.6% lower
Versus the North Yorkshire LAD median
Reported-crime change
+12.7
Per 1,000 residents over six months
What to check next
For movers, the next step is not to treat Middlesbrough as one single market. Use the table to compare the neighbourhoods on your shortlist, then check whether the price signal, reported-crime indicator, and everyday fit still match what you need.
Reported-crime trend
The chart shows Middlesbrough's reported-crime rate over the available authority export months, with the six-month comparison running from September 2025 to March 2026.
Neighbourhood table
The table compares Middlesbrough neighbourhoods by latest average price, latest reported-crime rate, six-month reported-crime change, and price-source coverage. It should be read as a comparison aid, not as a ranking of best or worst places.
| Neighbourhood | Average price | Price LSOA coverage | Reported crime per 1,000 | Six-month change |
|---|---|---|---|---|
| Acklam | GBP170,378 | 4/4 (100.0%) | 84.3 | +8.0 |
| Ayresome | GBP159,615 | 2/4 (50.0%) | 120.3 | +3.2 |
| Berwick Hills & Pallister | GBP96,931 | 3/6 (50.0%) | 213.4 | +1.5 |
| Brambles & Thorntree | GBP105,291 | 4/6 (66.7%) | 187.0 | +21.2 |
| Central | GBP172,817 | 2/7 (28.6%) | 491.0 | +26.5 |
| Coulby Newham | GBP159,946 | 3/6 (50.0%) | 131.1 | +10.1 |
| Hemlington | GBP155,367 | 2/4 (50.0%) | 192.1 | +16.9 |
| Kader | GBP197,898 | 3/3 (100.0%) | 84.2 | +1.1 |
| Ladgate | GBP131,593 | 4/4 (100.0%) | 130.1 | +22.9 |
| Linthorpe | GBP156,516 | 2/3 (66.7%) | 184.6 | +62.7 |
| Longlands & Beechwood | GBP121,524 | 1/7 (14.3%) | 258.8 | +8.0 |
| Marton East | GBP195,995 | 3/4 (75.0%) | 53.8 | -0.3 |
| Marton West | GBP244,491 | 3/3 (100.0%) | 47.9 | +17.1 |
| Newport | GBP69,916 | 5/7 (71.4%) | 210.6 | -8.0 |
| North Ormesby | GBP56,679 | 2/2 (100.0%) | 270.7 | +15.1 |
| Nunthorpe | GBP324,114 | 2/3 (66.7%) | 43.6 | +26.0 |
| Park | GBP133,003 | 4/6 (66.7%) | 132.4 | +3.8 |
| Park End & Beckfield | GBP93,341 | 4/5 (80.0%) | 194.7 | +18.0 |
| Stainton & Thornton | GBP186,053 | 1/3 (33.3%) | 106.6 | +11.4 |
| Trimdon | GBP192,798 | 2/3 (66.7%) | 60.9 | +11.2 |
Local examples
These rows show why readers should check specific neighbourhoods rather than rely on a single town-wide number.
Acklam
84.3 reported crimes per 1,000
Six-month change: +8.0 per 1,000. Price coverage: 4/4 LSOAs (100.0%).
Brambles & Thorntree
187.0 reported crimes per 1,000
Six-month change: +21.2 per 1,000. Price coverage: 4/6 LSOAs (66.7%).
Central
491.0 reported crimes per 1,000
Six-month change: +26.5 per 1,000. Price coverage: 2/7 LSOAs (28.6%).
Marton West
47.9 reported crimes per 1,000
Six-month change: +17.1 per 1,000. Price coverage: 3/3 LSOAs (100.0%).
Nunthorpe
43.6 reported crimes per 1,000
Six-month change: +26.0 per 1,000. Price coverage: 2/3 LSOAs (66.7%).
Methodology summary
Neighbourhood Finder analysed its March 2026 authority export, using neighbourhood-level house price and reported-crime data.
For the headline local-authority figures, neighbourhood rows were aggregated to Middlesbrough using population-weighted averages. The local price comparator is the latest-month median across North Yorkshire local-authority aggregates. The reported-crime change compares Middlesbrough's March 2026 rate with September 2025.
Reported crime reflects crimes recorded in the source data and should not be treated as a complete measure of lived experience. Average price is a local indicator and does not by itself measure affordability, income, deposits, or housing mix.
Latest reported-crime values are present across all 20 Middlesbrough neighbourhood rows. Price values are also present across all latest rows, and 15 rows have less than 100% price LSOA coverage. The table and download show the exact price LSOA coverage for each neighbourhood, so price figures are rounded and should be interpreted in light of that coverage.
For broader scoring context, use the methodology page.
Downloads and reuse
Downloads
Download the Middlesbrough neighbourhood CSV with average price, price LSOA coverage counts and percentages, reported-crime rate, and six-month reported-crime change.
Citation guidance
Full citation:
Neighbourhood Finder. (2026). Middlesbrough house prices and reported-crime trade-off (v1).
Short form:
Data: Neighbourhood Finder, Middlesbrough house prices and reported-crime trade-off (2026, v1).
Editorial reuse with attribution. Press contact: press@neighbourhoodfinder.co.uk