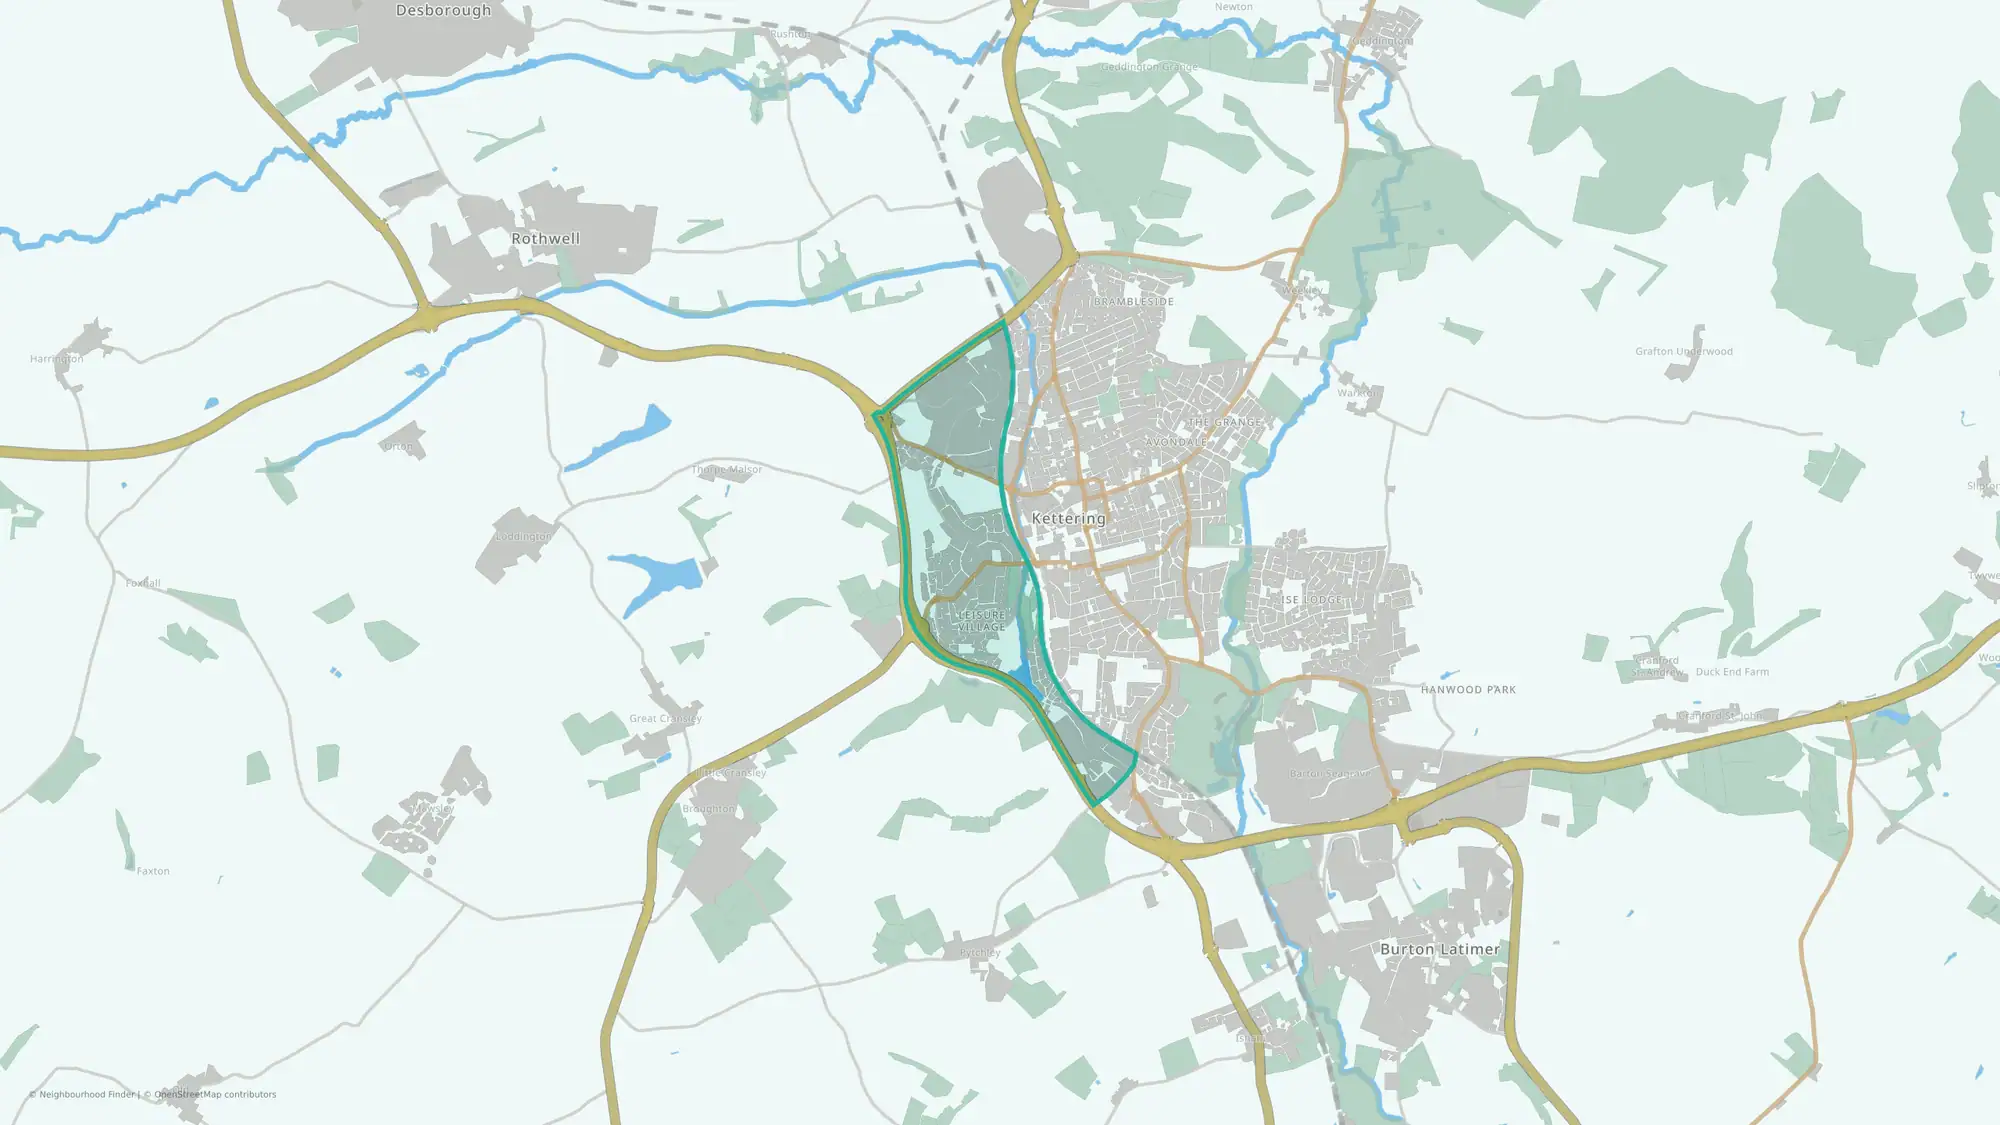
St. Peter
Strong on schools and transport
This public area guide compares St. Peter in North Northamptonshire using available headline data on crime, house prices, schools, flood risk and transport.
Is St. Peter a good place to live?
St. Peter may be a good fit for people who value stronger school performance and stronger transport access. It ranks strongly for stronger school performance and stronger transport access, while flood risk is around the national middle range and crime is around the national middle range. The public data does not show a single obvious weak signal among the available headline measures.
You can also compare nearby neighbourhoods in North Northamptonshire below.
For the full breakdown, open the app report for deeper comparisons and shortlist tools.
St. Peter at a glance
Best fit and trade-offs
May suit
- Families who care about school performance
- Movers who value stronger transport access
Watch out for
The public data shows a mixed profile, so the right fit depends on your priorities.
No additional grounded watch-out bullets are available.
Crime rate in St. Peter
Crime rate
Crime rate
14.74 per 1,000 people
Percentile
52nd percentile nationally
Crime levels are around the national middle range.
House prices in St. Peter
House prices
Average sold price
£284,244
Percentile
46th percentile nationally
House prices are around the national middle range.
Schools in St. Peter
Flood risk in St. Peter
Transport in St. Peter
What the full report adds
This public guide covers headline signals for crime, house prices, schools, flood risk and transport. The full report adds deeper lifestyle, health, green space, family and local life data, plus tools to compare and shortlist neighbourhoods.
FAQs
Is St. Peter a good place to live?
St. Peter may be a good fit for people who value stronger school performance and stronger transport access. It ranks strongly for stronger school performance and stronger transport access, while flood risk is around the national middle range and crime is around the national middle range. The public data does not show a single obvious weak signal among the available headline measures.
Is St. Peter safe?
St. Peter ranks in the 52nd percentile for crime data; in this dataset, a higher percentile indicates lower crime.
What are house prices like in St. Peter?
The average sold price is £284,244, with house prices in the 46th percentile nationally.
How are schools in St. Peter?
Schools rank in the 79th percentile nationally for this public profile.
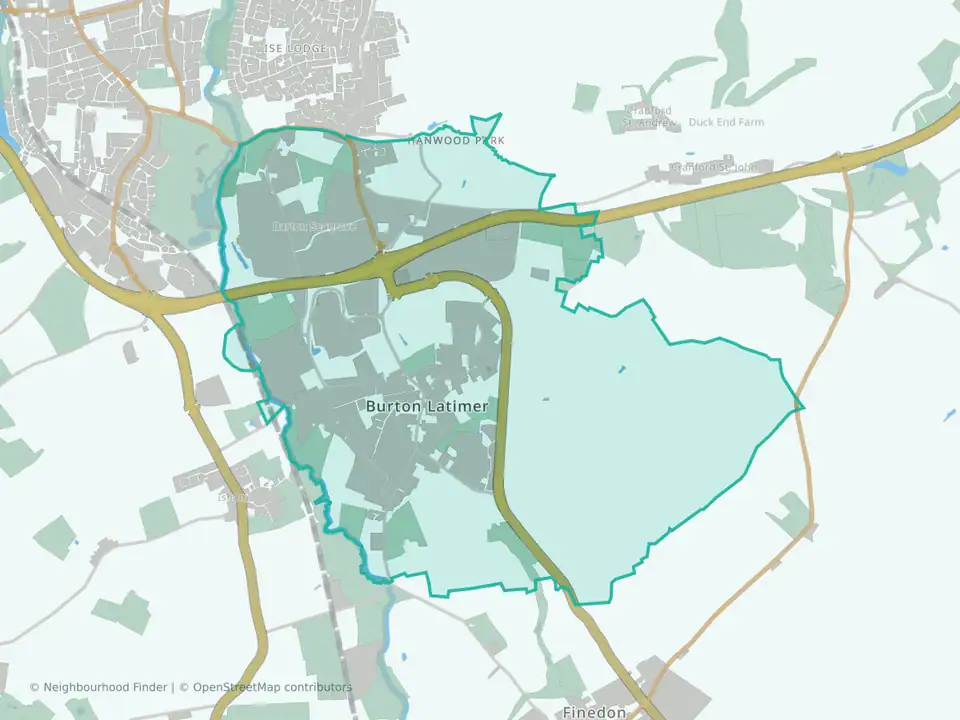
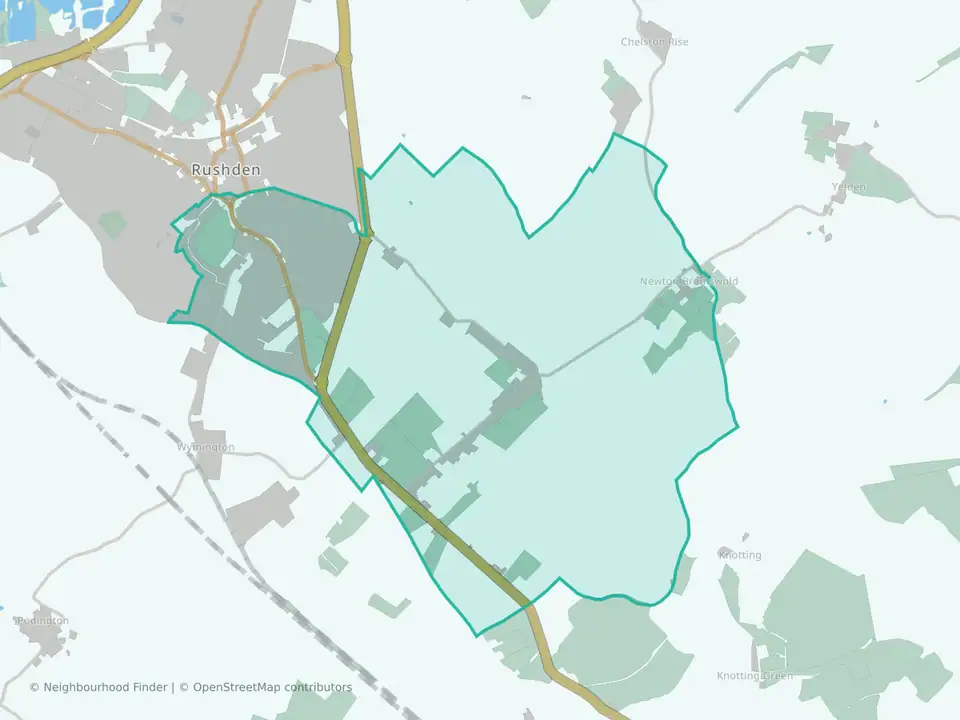
What neighbourhoods are near St. Peter?
Nearby public profiles include Barton Seagrave & Burton Latimer in North Northamptonshire and Rushden South in North Northamptonshire.