Neighbourhoods in The City of Brighton and Hove
Compare the neighbourhoods in The City of Brighton and Hove on house prices, crime, schools and transport, then read any area's full report.
The City of Brighton and Hove at a glance
- Neighbourhoods
- 23
- Each has its own report.
- Typical area median sale price
- £430,000
- Half of the 23 areas with enough sales are at or below this.
- Price range across areas
- £331,250 to £650,000
- From Regency to Westdene & Hove Park.
Compare neighbourhoods in The City of Brighton and Hove
Select a column heading to sort. Areas without a figure are listed last. Scroll the table sideways to see every column.
| Brunswick & Adelaide | £344,500 | No data | 9th | 86th |
|---|---|---|---|---|
| Central Hove | £375,000 | No data | 14th | 97th |
| Coldean & Stanmer | £352,500 | No data | 46th | 66th |
| Goldsmid | £393,500 | No data | 7th | 98th |
| Hangleton & Knoll | £497,500 | No data | 30th | 93rd |
| Hanover & Elm Grove | £450,000 | No data | 21st | 98th |
| Hollingdean & Fiveways | £507,500 | No data | 29th | 97th |
| Kemptown | £360,000 | No data | 10th | 98th |
| Moulsecoomb & Bevendean | £366,200 | No data | 21st | 89th |
| North Portslade | £358,000 | No data | 26th | 70th |
| Patcham & Hollingbury | £512,500 | No data | 33rd | 74th |
| Preston Park | £430,000 | No data | 48th | 92nd |
| Queen's Park | £457,000 | No data | 15th | 91st |
| Regency | £331,250 | No data | 24th | 97th |
| Rottingdean & West Saltdean | £497,500 | No data | 23rd | 38th |
| Round Hill | £437,500 | No data | 16th | 97th |
| South Portslade | £428,500 | No data | 75th | 96th |
| West Hill & North Laine | £365,000 | No data | 7th | 100th |
| Westbourne & Poets' Corner | £522,500 | No data | 19th | 96th |
| Westdene & Hove Park | £650,000 | No data | 62nd | 80th |
| Whitehawk & Marina | £475,000 | No data | 24th | 70th |
| Wish | £575,000 | No data | 9th | 91st |
| Woodingdean | £417,000 | No data | 37th | 38th |
Median sale prices are for standard HM Land Registry sales in the 12 months to August 2026, shown where an area had at least 10 sales.
Schools and transport are national percentiles: higher means stronger school results or transport access than more neighbourhoods nationally.
Guides to The City of Brighton and Hove
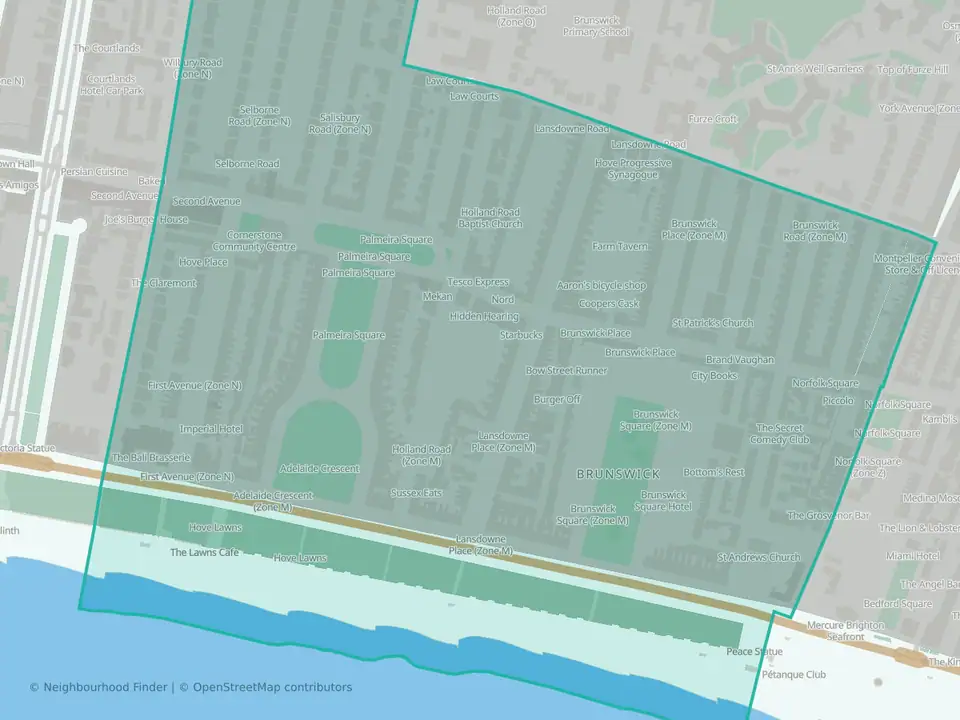
Brunswick & Adelaide
The City of Brighton and Hove

Central Hove
The City of Brighton and Hove

Coldean & Stanmer
The City of Brighton and Hove

Goldsmid
The City of Brighton and Hove

Hangleton & Knoll
The City of Brighton and Hove

Hanover & Elm Grove
The City of Brighton and Hove
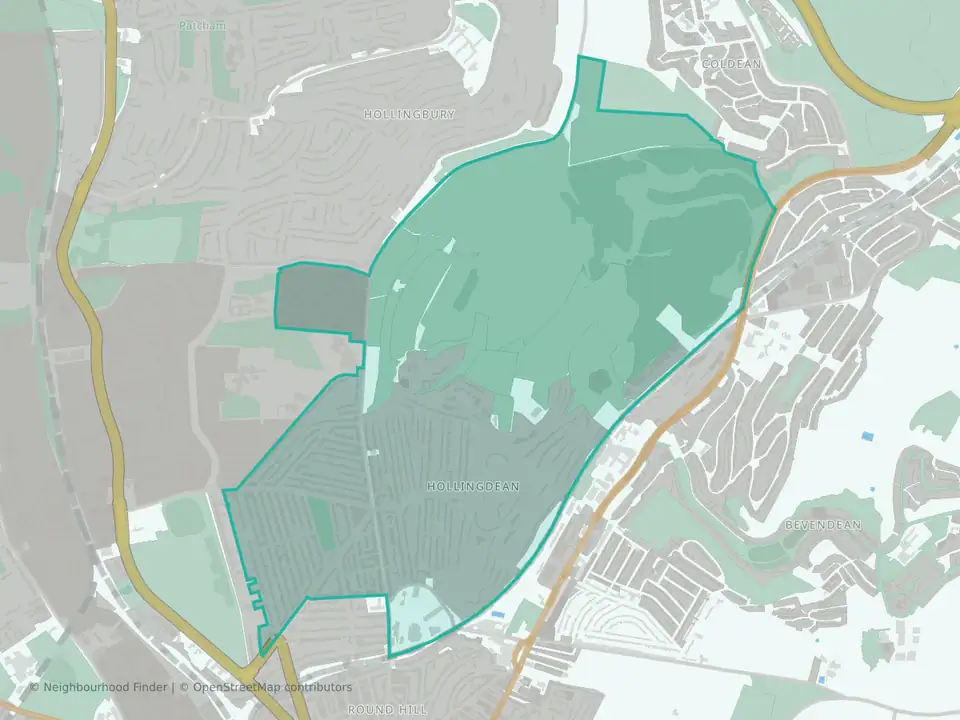
Hollingdean & Fiveways
The City of Brighton and Hove

Kemptown
The City of Brighton and Hove

Moulsecoomb & Bevendean
The City of Brighton and Hove

North Portslade
The City of Brighton and Hove

Patcham & Hollingbury
The City of Brighton and Hove

Preston Park
The City of Brighton and Hove

Queen's Park
The City of Brighton and Hove
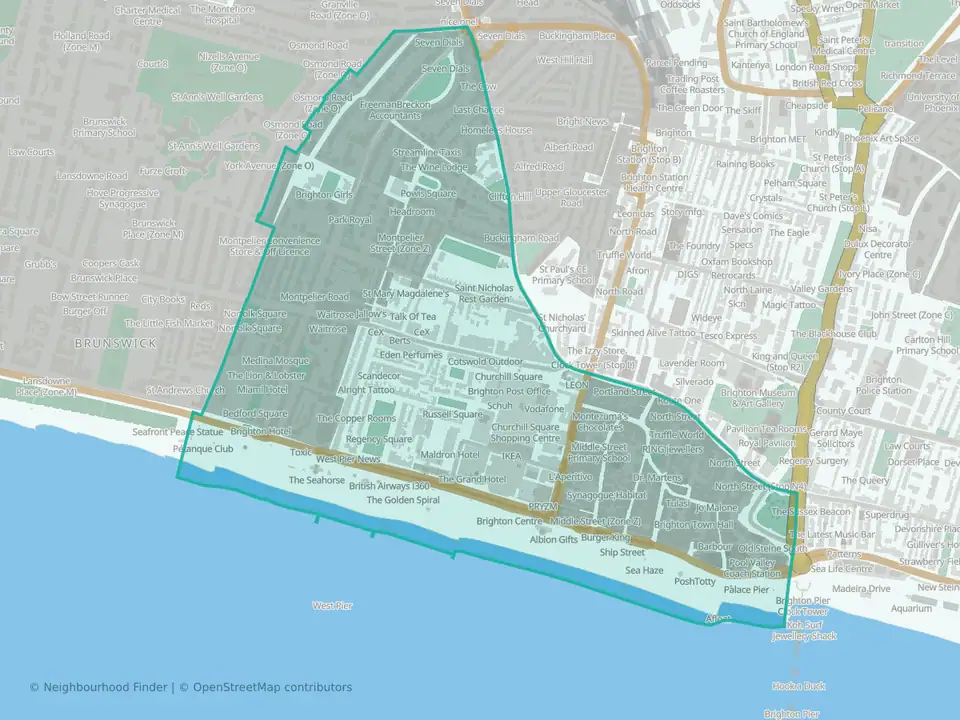
Regency
The City of Brighton and Hove

Rottingdean & West Saltdean
The City of Brighton and Hove

Round Hill
The City of Brighton and Hove

South Portslade
The City of Brighton and Hove

West Hill & North Laine
The City of Brighton and Hove
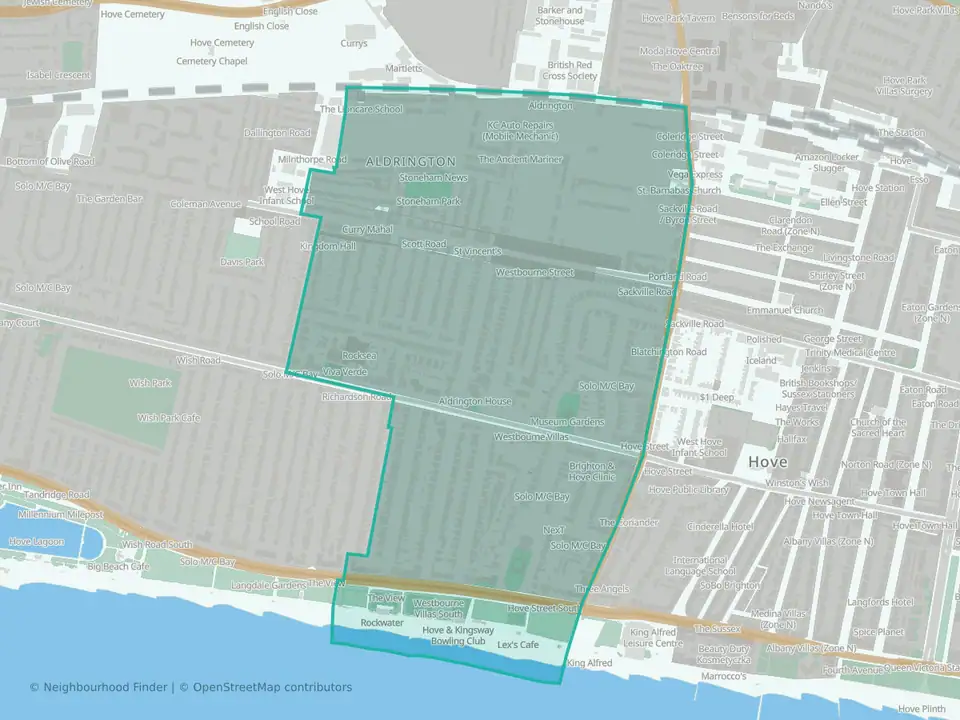
Westbourne & Poets' Corner
The City of Brighton and Hove
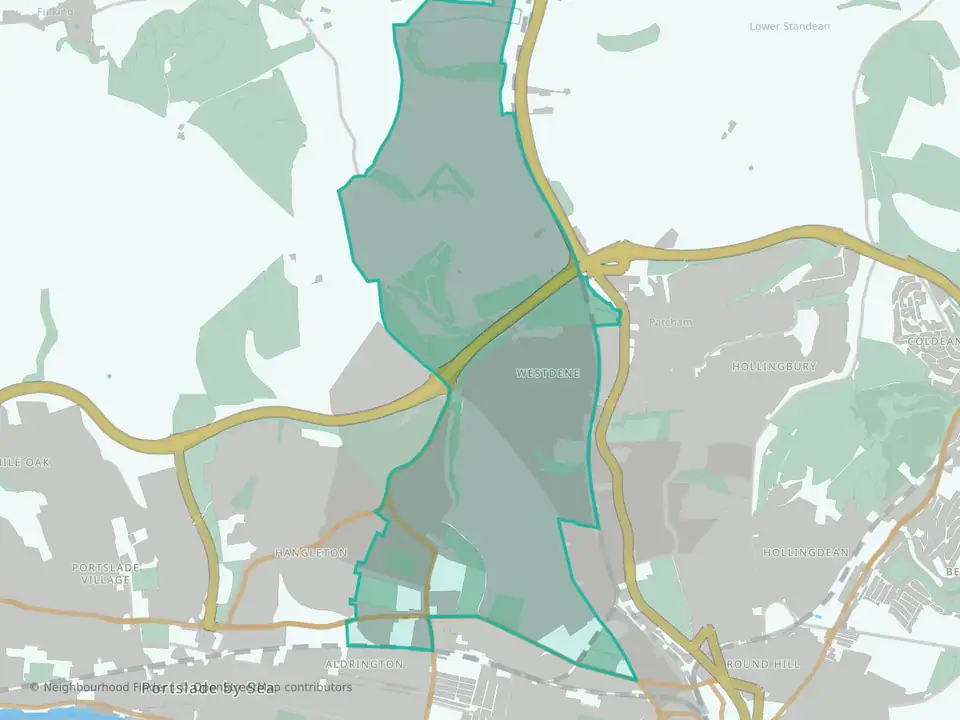
Westdene & Hove Park
The City of Brighton and Hove
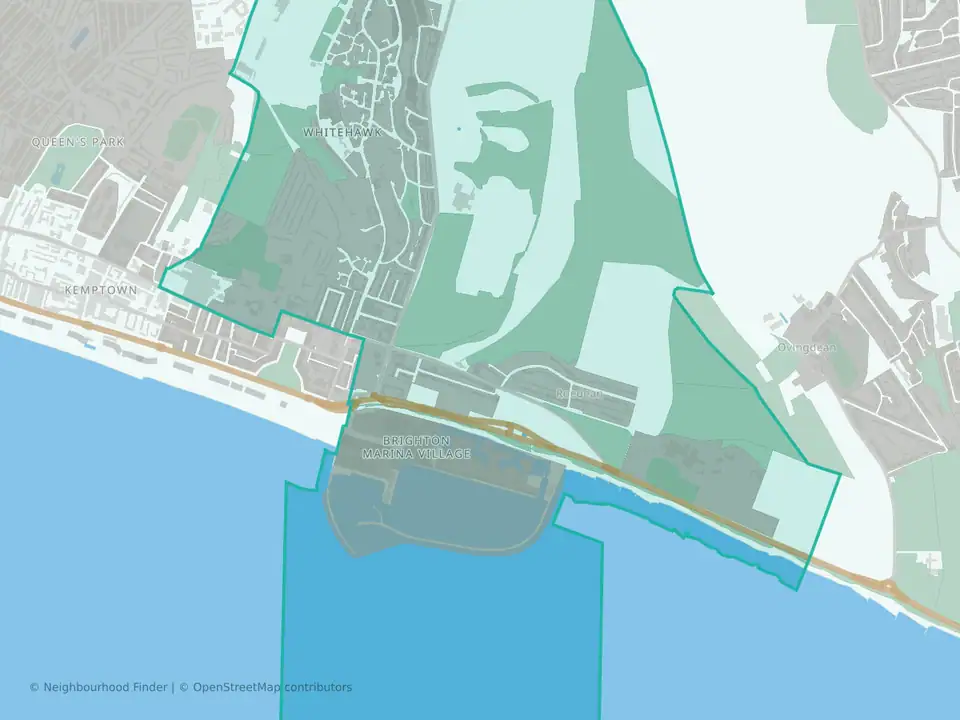
Whitehawk & Marina
The City of Brighton and Hove
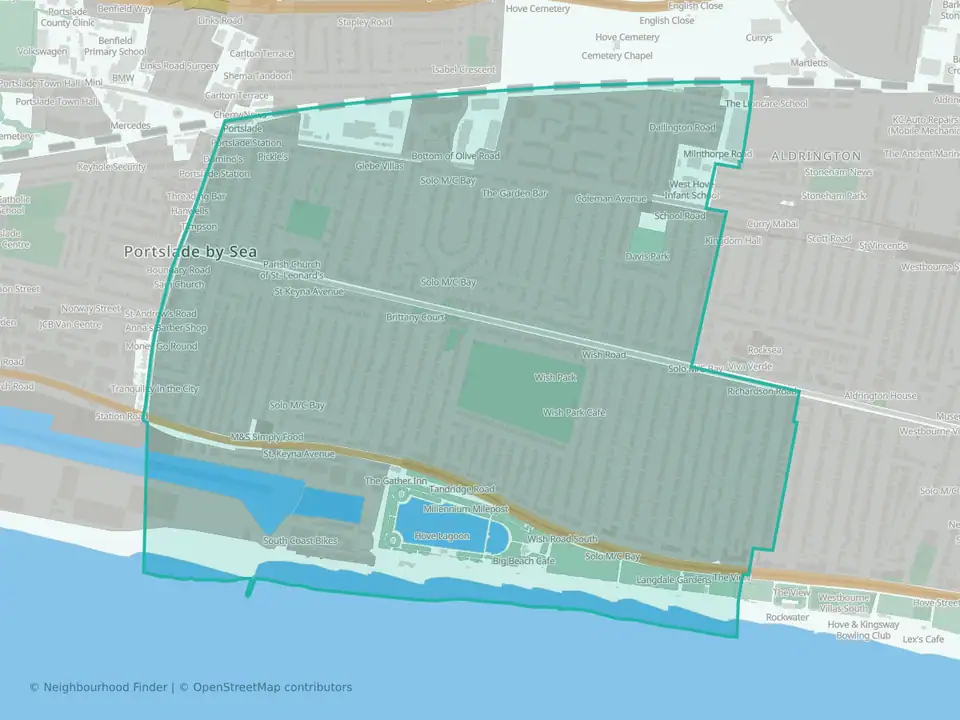
Wish
The City of Brighton and Hove

Woodingdean
The City of Brighton and Hove