Neighbourhoods in Tunbridge Wells
Compare the neighbourhoods in Tunbridge Wells on house prices, crime, schools and transport, then read any area's full report.
Tunbridge Wells at a glance
- Neighbourhoods
- 14
- Each has its own report.
- Typical area median sale price
- £454,000
- Half of the 14 areas with enough sales are at or below this.
- Price range across areas
- £358,000 to £501,250
- From St. James' to Pembury & Capel.
- Crime per 1,000 residents
- 35.5 to 112.2
- From Southborough & Bidborough to Park. The middle area records 69.2.
- Crime by type for each area
Compare neighbourhoods in Tunbridge Wells
Select a column heading to sort. Areas without a figure are listed last. Scroll the table sideways to see every column.
| Cranbrook, Sissinghurst & Frittenden | £400,000 | 79.5 | 21st | 12th |
|---|---|---|---|---|
| Culverden | £375,000 | 86.7 | 35th | 89th |
| Hawkhurst, Sandhurst & Benenden | £461,250 | 46.5 | 47th | 21st |
| High Brooms | £402,500 | 71.6 | 5th | 71st |
| Paddock Wood | £425,000 | 95 | 29th | 55th |
| Pantiles | £460,000 | 70.2 | 23rd | 70th |
| Park | £470,000 | 112.2 | 57th | 73rd |
| Pembury & Capel | £501,250 | 68.2 | 28th | 26th |
| Rural Tunbridge Wells | £493,748 | 38 | 66th | 6th |
| Rusthall & Speldhurst | £448,000 | 44.9 | 12th | 26th |
| Sherwood | £377,500 | 88.7 | 61st | 71st |
| Southborough & Bidborough | £462,500 | 35.5 | 23rd | 30th |
| St. James' | £358,000 | 52.6 | 18th | 86th |
| St. John's | £465,000 | 38.8 | 85th | 72nd |
Median sale prices are for standard HM Land Registry sales in the 12 months to August 2026, shown where an area had at least 10 sales.
Crime is recorded crime and anti-social behaviour in the 12 months to August 2026, per 1,000 residents; busy centres can show high rates because crimes are counted where they happen.
Schools and transport are national percentiles: higher means stronger school results or transport access than more neighbourhoods nationally.
Guides to Tunbridge Wells
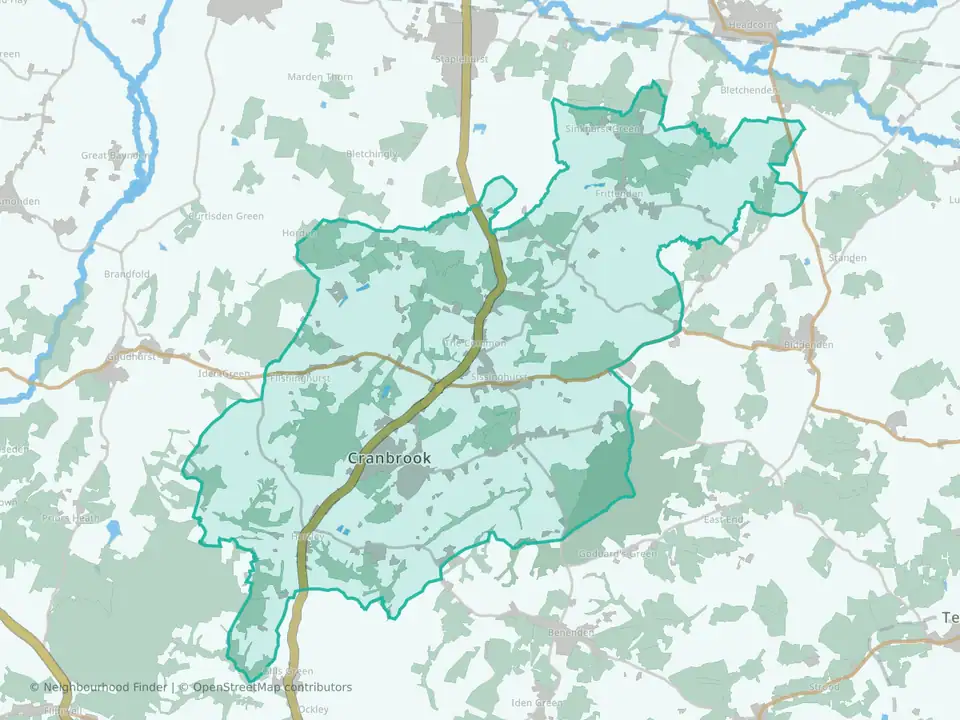
Cranbrook, Sissinghurst & Frittenden
Tunbridge Wells
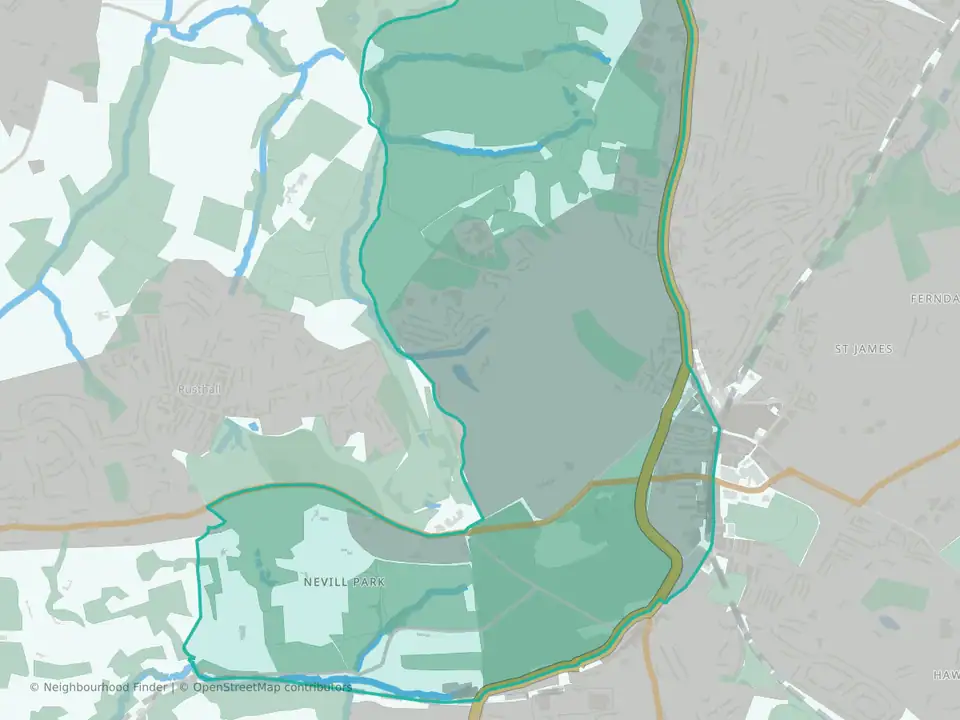
Culverden
Tunbridge Wells
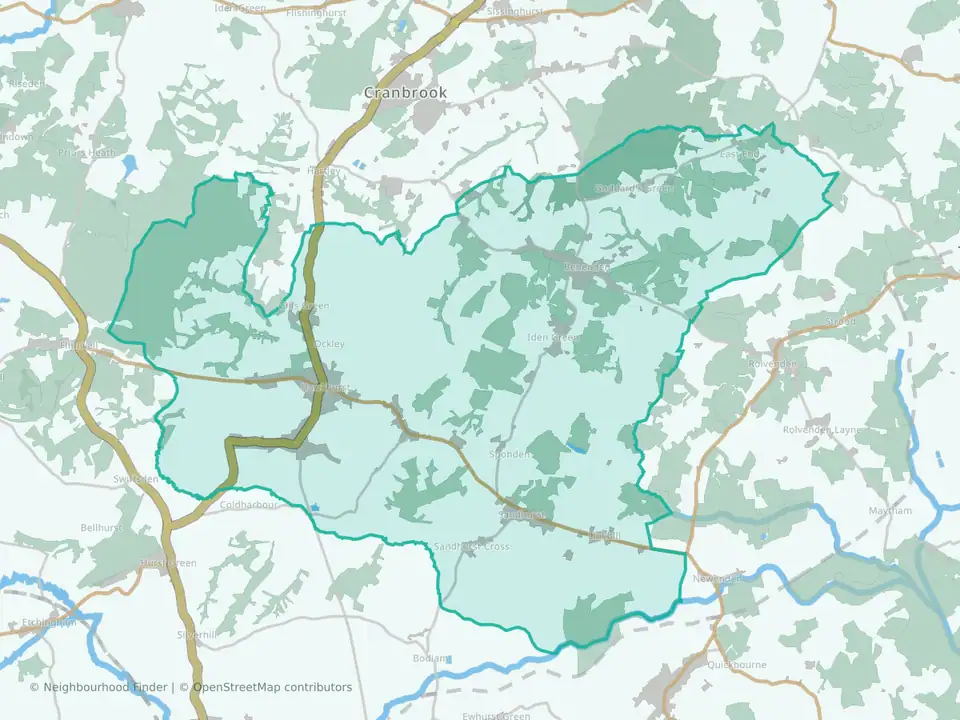
Hawkhurst, Sandhurst & Benenden
Tunbridge Wells
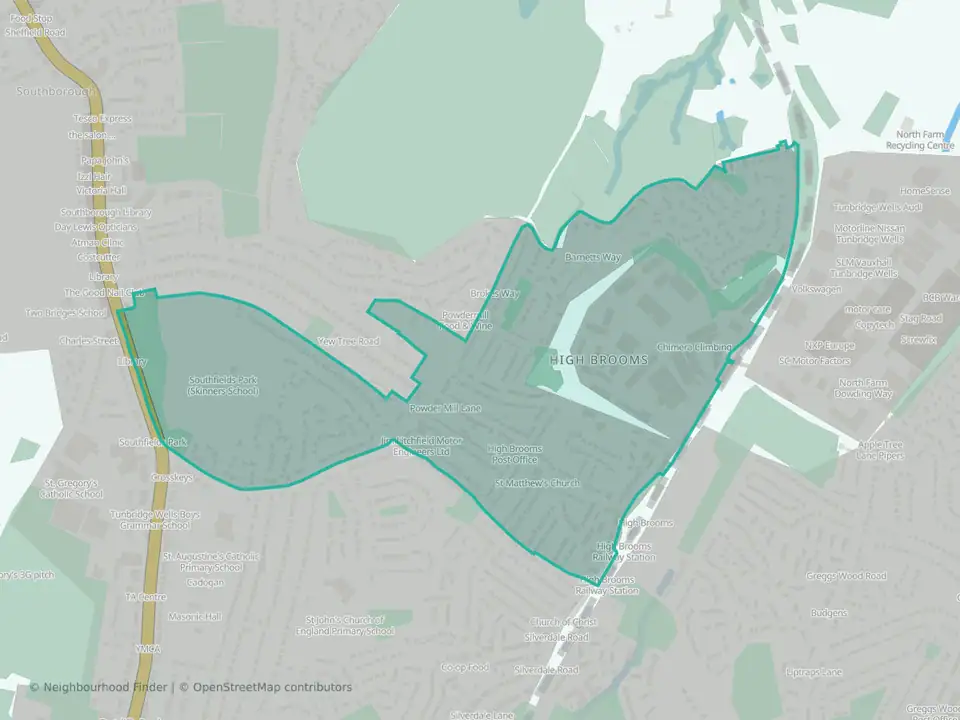
High Brooms
Tunbridge Wells
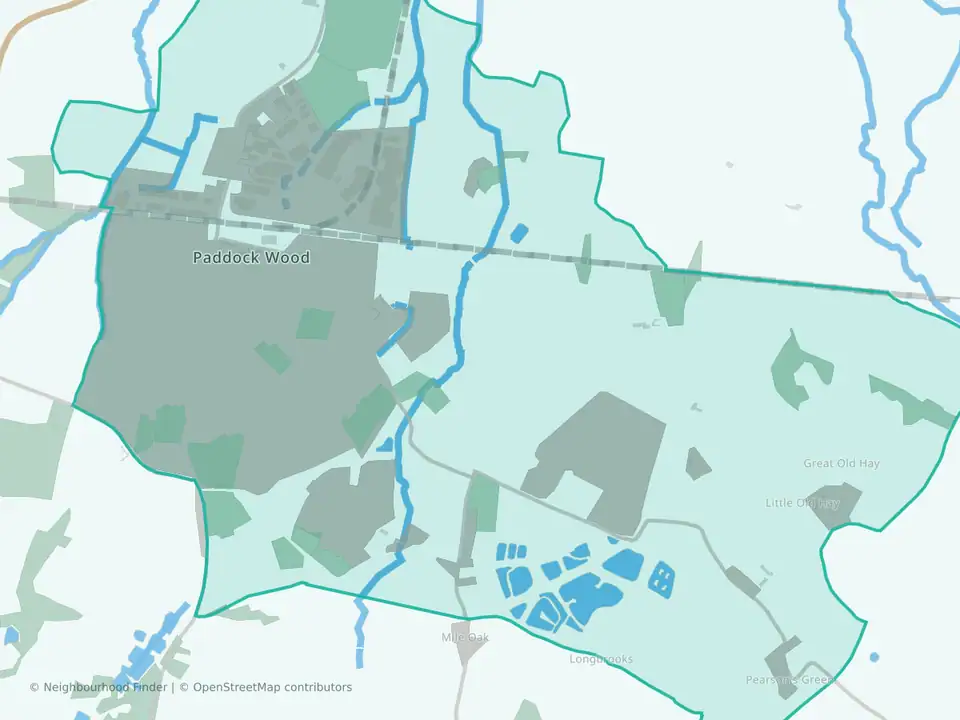
Paddock Wood
Tunbridge Wells
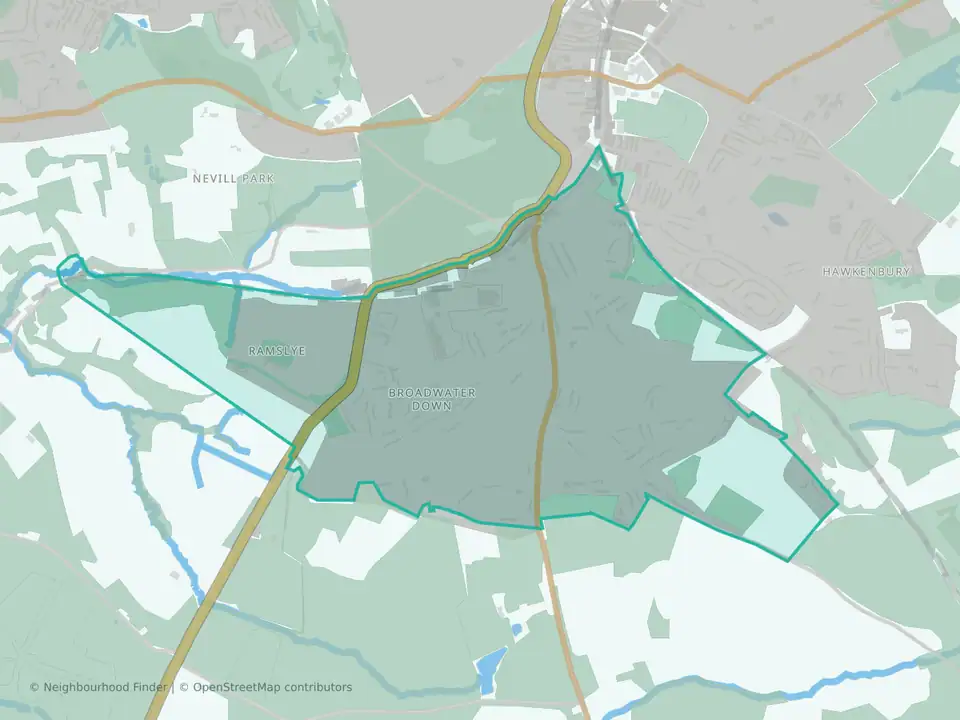
Pantiles
Tunbridge Wells
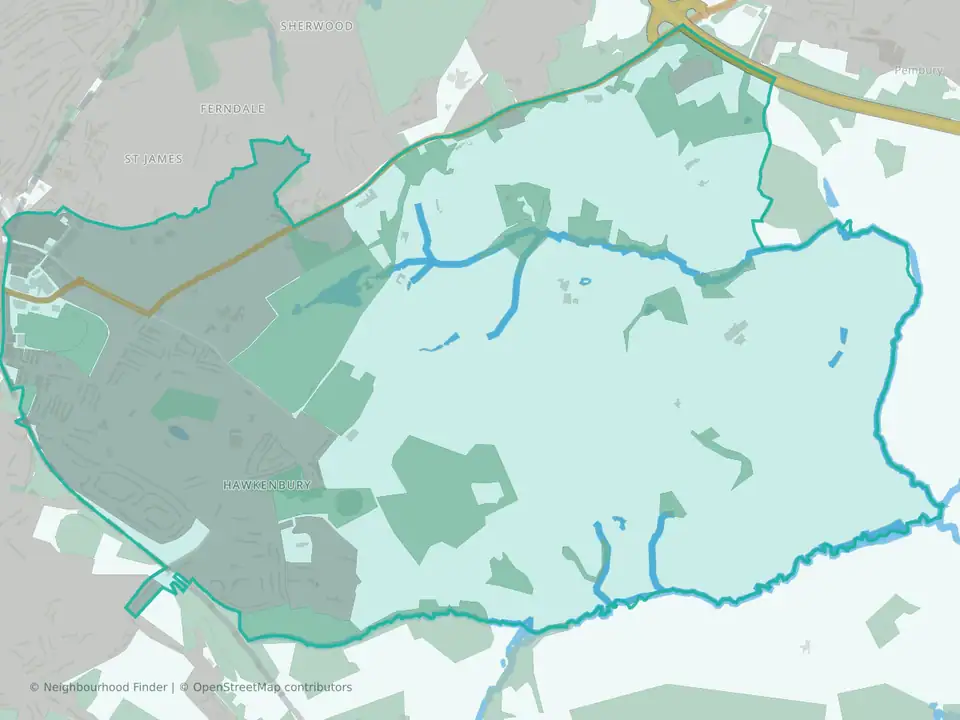
Park
Tunbridge Wells

Pembury & Capel
Tunbridge Wells
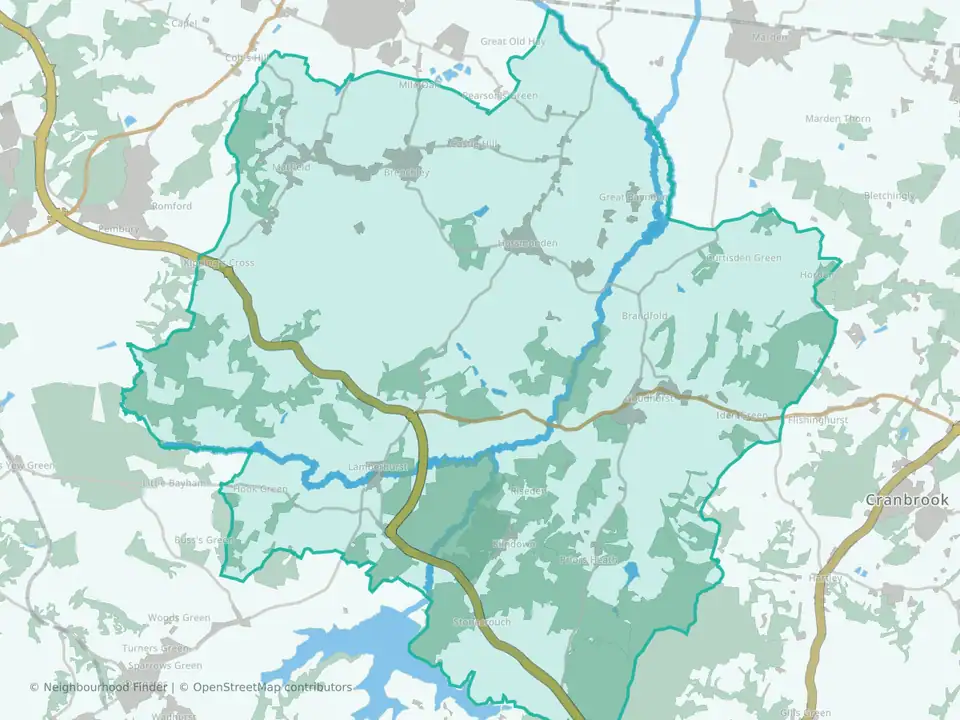
Rural Tunbridge Wells
Tunbridge Wells

Rusthall & Speldhurst
Tunbridge Wells

Sherwood
Tunbridge Wells

Southborough & Bidborough
Tunbridge Wells
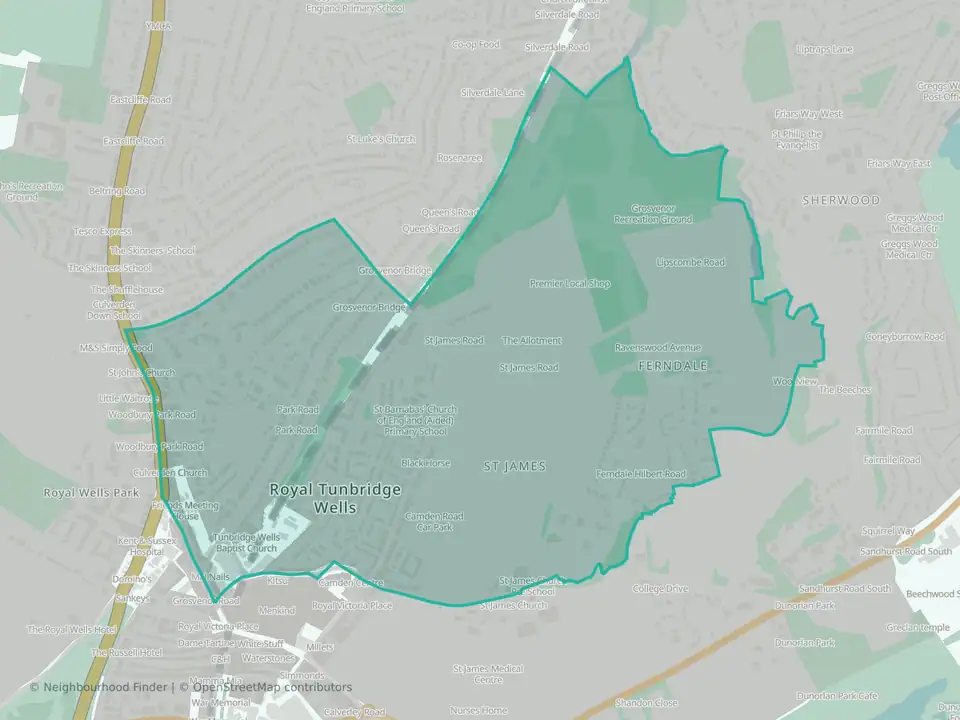
St. James'
Tunbridge Wells
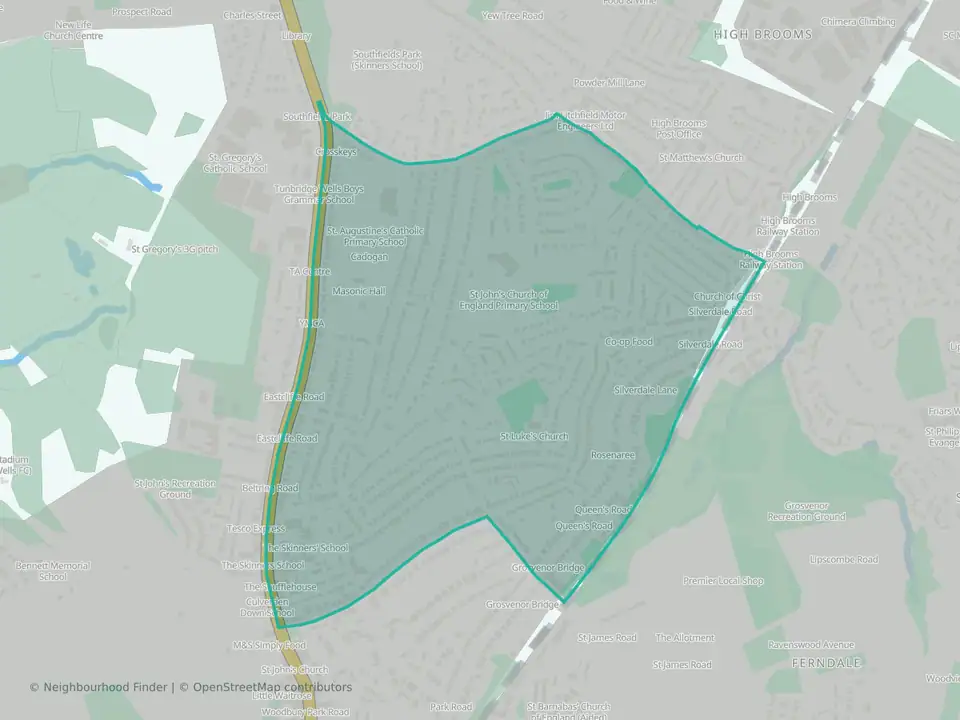
St. John's
Tunbridge Wells