Bulkington
A village east of Bedworth, dearer than the borough average, with some of its lowest recorded crime
Bulkington at a glance
- House prices
- £262,000
- Middle40th percentile
- Schools
- 33rd percentile
- Middle
- Transport
- 34th percentile
- Middle
- Crime rate
- 67.2 per 1,000 residents
- Middle51st percentile
- Flood risk
- 4.1% of the area in flood zones
- Middle43rd percentile
Underlying data dates vary by measure.
How to read these figuresIs Bulkington a good place to live?
Bulkington is a village on the eastern edge of the borough of Nuneaton and Bedworth, surrounded by farmland. Homes cost more than across the borough: the median sale price was £262,000 in the 12 months to August 2026, against £230,000 across Nuneaton and Bedworth and £295,000 across England.
Recorded crime is well below the borough and England rates: police recorded 67 crimes and anti-social behaviour incidents per 1,000 residents over the same 12 months, against 103 across Nuneaton and Bedworth and 94 across England. Only 2 of the borough's 20 areas record less. Burglary, at 6 per 1,000, is above both rates.
There is no railway station in the ward; Bedworth is about 1.6 miles from its centre and Coventry about 6.5 miles. Whitestone, in Nuneaton, records less crime but costs more; Slough, in Bedworth, costs less, with recorded crime a little higher.
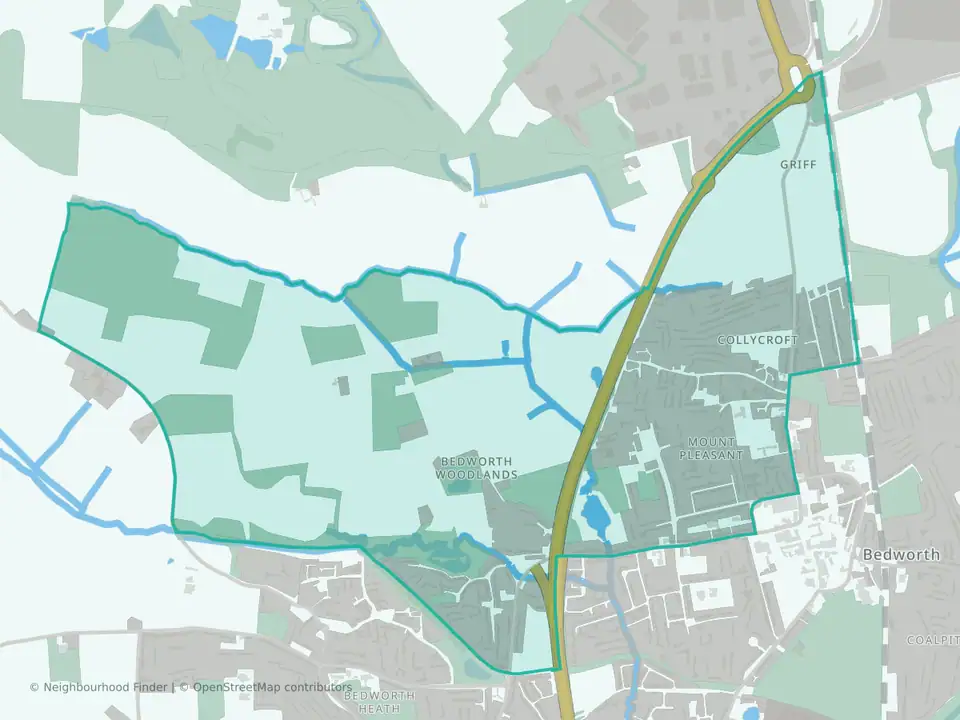
This guide covers Bulkington ward, which includes the village and the surrounding countryside: 4 small census areas, 13.7 square kilometres and 6,157 residents at the 2021 Census.
You can also compare nearby neighbourhoods in Nuneaton and Bedworth below.
How Bulkington compares
| Area | Crime and ASB per 1,000 | Violence and sexual offences per 1,000 | Median sale price |
|---|---|---|---|
| Bulkington | 67.2 | 27.0 | £262,000 (55) |
| Whitestone | 38.3 | 12.6 | £295,750 (68) |
| Slough, Bedworth | 81.1 | 27.1 | £245,000 (45) |
| Nuneaton and Bedworth | 103.3 | 39.3 | £230,000 (1,127) |
| England | 94.1 | 35.9 | £295,000 (502,418) |
In the same 12 months, semi-detached homes in Bulkington sold for a median of £254,000 (37 sales) and detached homes for £410,000 (15). Too few terraced homes or flats sold for a reliable figure.
What to check before you move
- Look at the street, not just the ward. police.uk maps recorded crime month by month, so you can see whether incidents cluster in particular places or near the home you are considering.
- Try the journey at the times you would travel. There is no railway station in the ward; Bedworth is about 1.6 miles from its centre, and our data does not include bus frequencies.
- Check home security. Burglary in the ward is above the borough and England rates, so ask about locks, alarms and any previous break-ins.
- Check the flood map for the specific property. Small parts of the ward are in flood zones 2 or 3, and surface-water risk is mapped separately.
- Check school places directly. Two primary schools are inside the ward but no secondary school; read the latest Ofsted reports and Warwickshire County Council's admission rules, because living nearby does not guarantee a place.
Areas to compare with Bulkington
Whitestone
Nuneaton and Bedworth
About 2 miles north, on the edge of Nuneaton, with much lower recorded crime (38 per 1,000) and a higher median sale price, £295,750.
Read the Whitestone guideSlough
Nuneaton and Bedworth
About 3 miles west, in Bedworth, with slightly higher recorded crime (81 per 1,000) and a lower median sale price, £245,000.
Read the Slough guideSources: police.uk recorded crime (September 2025 to August 2026); ONS 2021 Census population; HM Land Registry Price Paid Data (September 2025 to August 2026); Environment Agency flood zones; NaPTAN station locations; Ofsted school register. Updated 4 November 2026.
Best fit and trade-offs
May suit
The public data shows a mixed profile, so the right fit depends on your priorities.
No additional grounded may-suit bullets are available.
Watch out for
Check the exact address, school admissions and your daily journeys. Area averages cannot describe every street.
No additional grounded watch-out bullets are available.
Crime rate in Bulkington
Crime rate
- Crime rate
- 67.2 per 1,000 residents
- Percentile
- 51st percentile nationally
Crime levels are around the national middle range.
Recorded crimes and anti-social behaviour per 1,000 residents over the 12 months to August 2026. Higher crime percentiles indicate lower recorded crime. Busy centres can show high rates because crimes are counted where they happen but divided by the people who live there.
House prices in Bulkington
House prices
- Median sale price
- £262,000
- Percentile
- 40th percentile nationally
House prices are around the national middle range.
Median of 55 standard sales over the 12 months to August 2026, from HM Land Registry. Lower price percentiles indicate lower prices nationally. This is an area figure, not a valuation of a particular home.
Crime by type in Bulkington
Recorded crime by type
The largest recorded type in Bulkington is violence, sexual offences and weapons, at 27.0 per 1,000 residents: lower than Nuneaton and Bedworth (39.3) and lower than England (35.9).
| Type | Bulkington | Nuneaton and Bedworth | England |
|---|---|---|---|
| Violence, sexual offences and weapons | 27.0 | 39.3 | 35.9 |
| Anti-social behaviour | 11.0 | 17.1 | 10.7 |
| Criminal damage and arson | 6.5 | 7.6 | 6.8 |
| Burglary | 6.0 | 4.3 | 3.7 |
| Public order | 4.5 | 6.8 | 6.6 |
| Vehicle crime | 4.4 | 6.4 | 5.3 |
| Theft, including shoplifting | 3.7 | 15.9 | 18.1 |
| Other crime | 2.4 | 2.3 | 2.2 |
| Drugs | 0.8 | 2.0 | 3.4 |
| Robbery | 0.8 | 1.5 | 1.5 |
Recorded crime is not the same as personal risk. How to read crime figures for an area · Check another area
Schools in Bulkington
Schools
33rd percentile nationally
Higher percentiles indicate stronger schools indicators nationally.
Flood risk in Bulkington
Flood risk
4.1% of the area in flood zones 2 or 3
Land in Environment Agency river and sea flood zones 2 or 3. Zone 3, the higher-probability zone, covers 3.3% of the area. That is the 43rd percentile among neighbourhoods in England, where higher means more flood-zone land. Surface water is not included, and this is not an address-level assessment: check the flood map for the specific property.
Transport in Bulkington
Transport
34th percentile nationally
Higher percentiles indicate stronger transport indicators nationally.
FAQs
Is Bulkington a nice place to live?
It depends on what you are prioritising. Bulkington records some of the lowest crime in Nuneaton and Bedworth, but homes cost more than across the borough, with a median sale price of £262,000 in the year to August 2026, and there is no railway station in the village.
Is Bulkington safe?
Police recorded 67 crimes and anti-social behaviour incidents per 1,000 residents in the 12 months to August 2026, compared with 103 across Nuneaton and Bedworth and 94 across England. Recorded crime is not the same as personal risk, so check police.uk for the streets you are considering.
What are house prices like in Bulkington?
Homes sold for a median of £262,000 in the 12 months to August 2026, across 55 standard sales. Semi-detached homes sold for a median of £254,000 and detached homes for £410,000.
Is Bulkington a good place to live?
Bulkington has a mixed public data profile, so whether it is a good fit depends on which factors matter most to you. These headline measures are a starting point; check the specific home and the routes you would use.
How are schools in Bulkington?
Schools rank in the 33rd percentile nationally for this public profile.
What neighbourhoods are near Bulkington?
Nearby public profiles include Weddington in Nuneaton and Bedworth and Slough in Nuneaton and Bedworth.