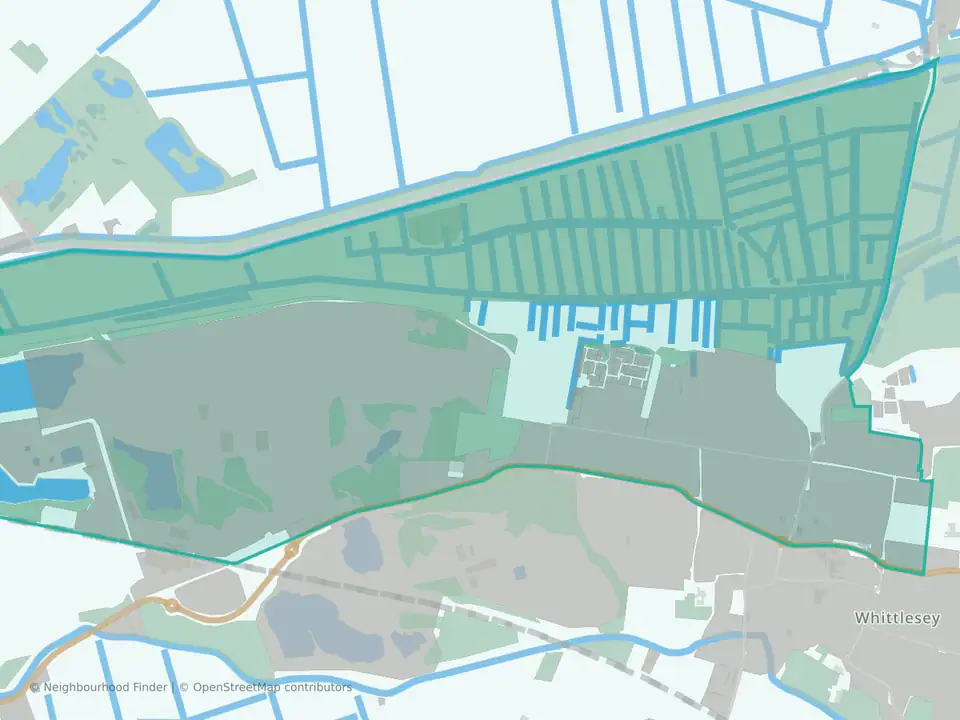
Elm & Christchurch
Strong on schools, with transport to consider
Elm & Christchurch at a glance
- House prices
- £245,000
- Middle34th percentile
- Schools
- 82nd percentile
- Strong
- Transport
- 6th percentile
- Weak
- Crime rate
- 89.5 per 1,000 residents
- Middle31st percentile
- Flood risk
- 80.7% of the area in flood zones
- More flood-zone land97th percentile
Underlying data dates vary by measure.
How to read these figuresIs Elm & Christchurch a good place to live?
Elm & Christchurch may be a good fit for people who value stronger school performance. Transport access appears weaker and more of the area is in a flood zone than most neighbourhoods in England, so those factors are worth checking against your priorities.
You can also compare nearby neighbourhoods in Fenland below.
Elm & Christchurch and nearby areas
| Area | Median sale price | Crime per 1,000 residents |
|---|---|---|
| Elm & Christchurch | £245,000 | 89.5 |
| Whittlesey Lattersey | £250,000 | 78.3 |
| Whittlesey North West | £251,250 | 58.2 |
Same sources and periods as the figures above. Each area has its own full guide.
Best fit and trade-offs
May suit
- Families who care about school performance
Watch out for
- Transport access appears weaker than most neighbourhoods nationally
- More of the area is in river or sea flood zones than most neighbourhoods in England; check the flood map for the specific property
Crime rate in Elm & Christchurch
Crime rate
- Crime rate
- 89.5 per 1,000 residents
- Percentile
- 31st percentile nationally
Recorded crime is relatively higher; higher percentiles indicate lower crime.
Recorded crimes and anti-social behaviour per 1,000 residents over the 12 months to August 2026. Higher crime percentiles indicate lower recorded crime. Busy centres can show high rates because crimes are counted where they happen but divided by the people who live there.
House prices in Elm & Christchurch
House prices
- Median sale price
- £245,000
- Percentile
- 34th percentile nationally
House prices are below the national middle range.
Median of 57 standard sales over the 12 months to August 2026, from HM Land Registry. Lower price percentiles indicate lower prices nationally. This is an area figure, not a valuation of a particular home.
Crime by type in Elm & Christchurch
Recorded crime by type
The largest recorded type in Elm & Christchurch is violence, sexual offences and weapons, at 51.3 per 1,000 residents: higher than Fenland (39.3) and higher than England (35.9).
| Type | Elm & Christchurch | Fenland | England |
|---|---|---|---|
| Violence, sexual offences and weapons | 51.3 | 39.3 | 35.9 |
| Criminal damage and arson | 10.5 | 7.9 | 6.8 |
| Anti-social behaviour | 9.2 | 13.4 | 10.7 |
| Theft, including shoplifting | 6.6 | 11.6 | 18.1 |
| Burglary | 4.4 | 2.8 | 3.7 |
| Public order | 3.2 | 4.3 | 6.6 |
| Other crime | 2.2 | 3.2 | 2.2 |
| Drugs | 1.0 | 2.9 | 3.4 |
| Vehicle crime | 0.6 | 2.6 | 5.3 |
| Robbery | 0.4 | 0.5 | 1.5 |
Recorded crime is not the same as personal risk. How to read crime figures for an area · Check another area
Schools in Elm & Christchurch
Schools
82nd percentile nationally
Higher percentiles indicate stronger schools indicators nationally.
Flood risk in Elm & Christchurch
Flood risk
80.7% of the area in flood zones 2 or 3
Land in Environment Agency river and sea flood zones 2 or 3. Zone 3, the higher-probability zone, covers 70.2% of the area. That is the 97th percentile among neighbourhoods in England, where higher means more flood-zone land. Surface water is not included, and this is not an address-level assessment: check the flood map for the specific property.
Transport in Elm & Christchurch
Transport
6th percentile nationally
Higher percentiles indicate stronger transport indicators nationally.
FAQs
Is Elm & Christchurch a good place to live?
Elm & Christchurch may be a good fit for people who value stronger school performance. Transport access appears weaker and more of the area is in a flood zone than most neighbourhoods in England, so those factors are worth checking against your priorities.
Is Elm & Christchurch safe?
Elm & Christchurch ranks in the 31st percentile for crime data; in this dataset, a higher percentile indicates lower crime.
What are house prices like in Elm & Christchurch?
The median sale price was £245,000 in the 12 months to August 2026. House prices are in the 34th percentile nationally; lower percentiles indicate lower prices.
How are schools in Elm & Christchurch?
Schools rank in the 82nd percentile nationally for this public profile.
What neighbourhoods are near Elm & Christchurch?
Nearby public profiles include Whittlesey Lattersey in Fenland and Whittlesey North West in Fenland.