Did Stockton's shoplifting rise shift beyond the town centre?
Stockton Council says town-centre shop theft fell 17.8%. But police data for the wider borough shows recorded shoplifting more than doubled, from 1,954 crimes in the year to June 2025 to 4,206 in the year to June 2026.
- Town-centre claim
- 17.8% fall
- Borough police data
- 1,954 → 4,206
- Areas mapped
- 28 neighbourhoods
The story
Two different pictures—and a question about where shoplifting rose
Stockton-on-Tees Borough Council says shop theft in Stockton Town Centre fell 17.8% over the preceding six months.
The latest available police.uk data tells a very different story across the wider borough. Recorded shoplifting rose from 1,954 crimes in the rolling year to June 2025 to 4,206 in the year to June 2026—an increase of 2,252, or 115.3%.
Both figures could be true. The council paper covers the town centre and does not publish the underlying numbers or calculation for its claim, while the police data covers the whole borough and a rolling 12-month period.
That raises the more interesting question: has shoplifting fallen in the centre but shifted into surrounding neighbourhoods? The available data cannot prove displacement, but it can show where the largest recorded increases were concentrated.
Across the same 28 neighbourhood areas, the number of police.uk records excluding those mapped to prison locations rose from 23,224 in the rolling year to June 2025 to 26,084 in the year to June 2026.
That is an increase of 2,860 reports, raising the population-weighted rate from 116.1 to 130.4 per 1,000 residents.
Shoplifting accounted for 78.7% of that adjusted borough-wide increase.
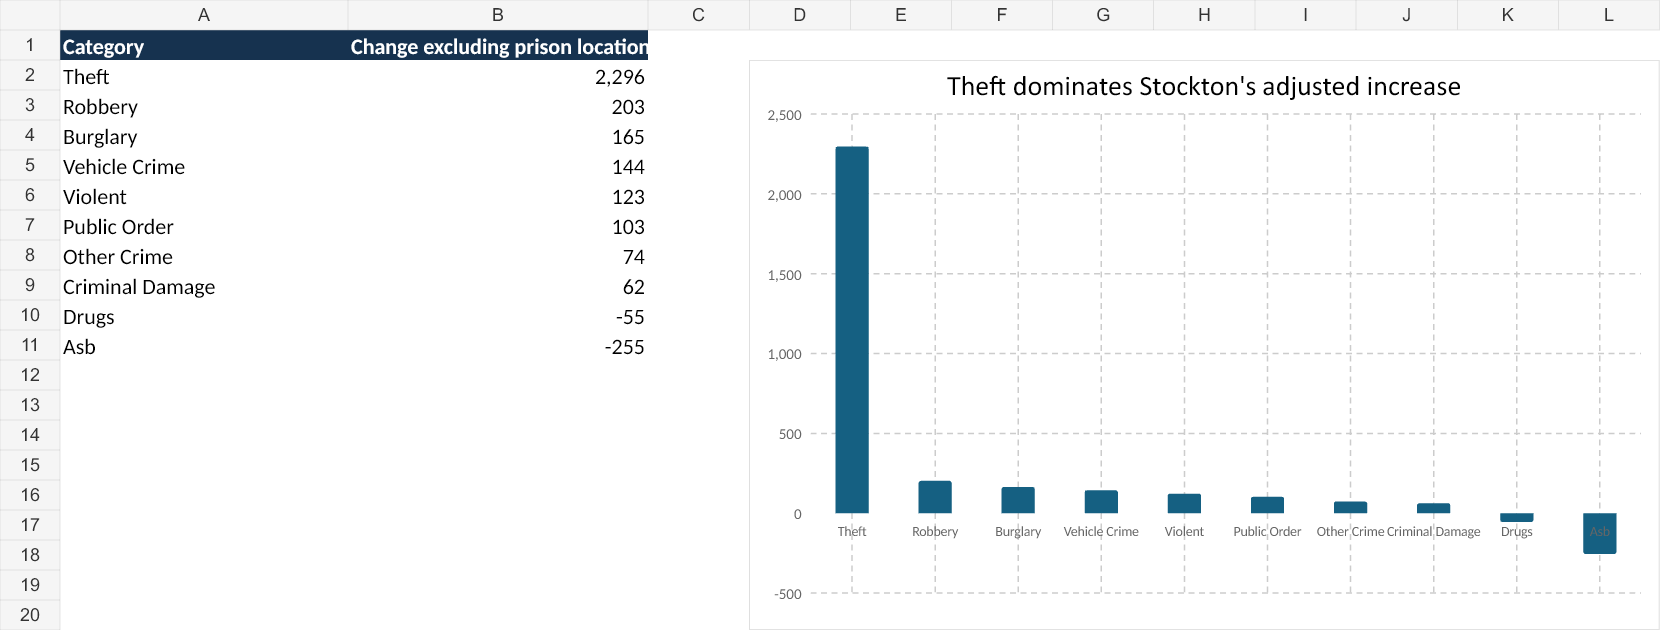
The pattern is more specific than a general rise in every form of recorded crime. After the prison-location adjustment, the broader theft category increased by 2,296 reports, robbery by 203, burglary by 165 and vehicle crime by 144. The broad violence and sexual-offences category rose by 123, while anti-social behaviour fell by 255 and drug reports fell by 55.
Adjusted reports
23,224 → 26,084
Rolling years to June 2025 and June 2026
Adjusted rate
116.1 → 130.4
Reports per 1,000 residents
Shoplifting
1,954 → 4,206
2,252 additional reports
Which categories changed
Theft dominates the prison-adjusted category increase, while anti-social behaviour and drugs move in the opposite direction.
Monthly pattern
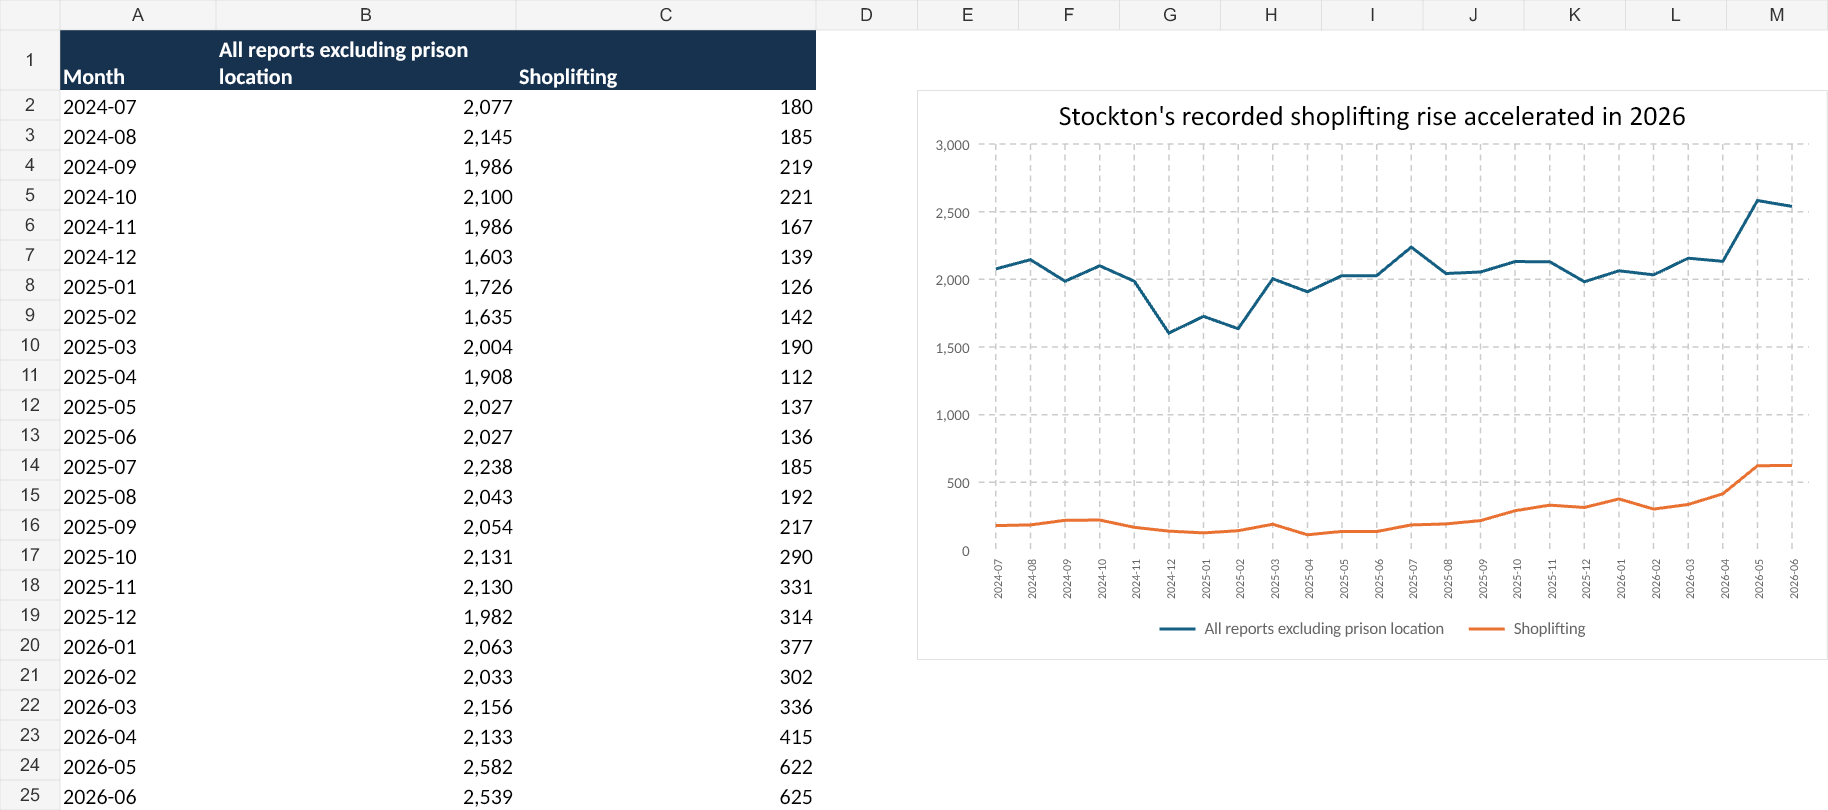
Shoplifting accelerates in 2026 while the prison-adjusted all-report total remains much higher. Monthly figures are shown to make the timing visible without implying a single cause.
Where the biggest increases occurred
The biggest adjusted neighbourhood increases were in Mandale & Victoria, Village and Roseworth.
Mandale & Victoria recorded 865 additional reports overall. Within the police.uk shoplifting data, approximate locations described as “On or near Charles Street” and “On or near Pearson Way” added 618 and 259 reports respectively.
Village recorded 494 additional reports overall, while shoplifting reports mapped near Thorntree Road increased by 361. Roseworth recorded 415 additional reports overall, with the Redhill Road Shops location adding 380 shoplifting reports.
Police.uk locations are approximate and anonymised. These figures show concentration around mapped locations; they do not identify an exact premises or explain every incident.
Why both figures could be true
The borough-wide increase sits alongside a different published town-centre picture.
A Stockton-on-Tees Borough Council report published for its Community Safety Select Committee in May 2026 said shop theft in Stockton Town Centre had fallen 17.8% over the preceding six months. The paper does not show the underlying offence counts, dates or calculation behind that percentage.
The same report described a retail-crime process being trialled in Stockton by Cleveland Police's Primary Crime Investigation Unit. Prepared evidence packs—including statements and footage—were intended to improve engagement with businesses and allow neighbourhood officers to act on more complete case files.
It also said Cleveland Police was actively encouraging retailers to report incidents so the force could improve intelligence and identify repeat offenders.
Cleveland Police's published updates show how prolific offending can generate many separate reports. In January it described two people charged with 22 and 28 thefts. A February update described two further people charged in connection with 22 and 18 alleged thefts at Stockton stores.
These examples do not account for the whole borough increase. They show why the number of recorded offences can reflect repeated incidents, retailer reporting, police case-building and enforcement as well as changes in underlying offending.
The Office for National Statistics makes the same caution nationally: recent changes in recorded shoplifting may reflect both changes in offending and improved reporting through closer engagement between police and retailers.
The town-centre 17.8% decline uses a different geography and six-month period from the borough-wide rolling-year comparison. The figures are not a like-for-like contradiction, and the neighbourhood pattern alone cannot prove that offending shifted from one place to another.
Why the raw Stockton number is misleading
Before adjustment, the Stockton total rose from 23,491 to 27,459 reports, increasing the rate by 19.8 per 1,000.
But records mapped by police.uk to locations labelled “On or near Prison” rose from 267 to 1,375—a net increase of 1,108. Most of the step-change appeared in the broad violence and sexual-offences category.
Independent public evidence does not support treating that mapped cluster as a sudden change in neighbourhood violence. HM Inspectorate of Prisons described violence at Kirklevington Grange as rare after its September 2024 inspection. The prison's 2025 Independent Monitoring Board report described it as safe with a small number of incidents and noted that some intelligence-report categorisations had changed.
Neighbourhood Finder therefore removed every record mapped to a prison location from both rolling periods before calculating the reader-facing borough rate. The raw and adjusted figures remain available in the downloadable evidence so the decision can be audited.
This is not evidence that Stockton as a whole is dangerous or unsafe. Police-recorded reports are not a complete measure of lived experience or personal risk, and the borough average masks large differences between neighbourhoods.
| Measure | Year to June 2025 | Year to June 2026 | Change |
|---|---|---|---|
| All police.uk-derived reports | 23,491 | 27,459 | +3,968 |
| Mapped “On or near Prison” | 267 | 1,375 | +1,108 |
| Reports excluding prison locations | 23,224 | 26,084 | +2,860 |
| Adjusted rate per 1,000 | 116.1 | 130.4 | +14.3 |
All 28 Stockton neighbourhoods
The table uses the same prison-adjusted method throughout and is sorted by adjusted count change. It is a comparison aid, not a best-or-worst ranking.
| Neighbourhood | Population | 2025 adjusted count | 2026 adjusted count | Adjusted change | 2026 rate / 1,000 | Rate change | Raw change | Prison adjustment |
|---|---|---|---|---|---|---|---|---|
| Mandale & Victoria | 8,108 | 2,093 | 2,958 | +865 | 364.82 | +106.68 | +865 | +0 |
| Village | 8,696 | 824 | 1,318 | +494 | 151.56 | +56.81 | +494 | +0 |
| Roseworth | 8,152 | 1,354 | 1,769 | +415 | 217.00 | +50.91 | +415 | +0 |
| Stockton Town Centre | 6,485 | 3,789 | 3,938 | +149 | 607.25 | +22.98 | +149 | +0 |
| Ingleby Barwick North | 12,241 | 463 | 590 | +127 | 48.20 | +10.37 | +127 | +0 |
| Billingham East | 6,994 | 897 | 1,011 | +114 | 144.55 | +16.30 | +114 | +0 |
| Eaglescliffe West | 7,623 | 369 | 458 | +89 | 60.08 | +11.68 | +89 | +0 |
| Stainsby Hill | 6,909 | 1,104 | 1,193 | +89 | 172.67 | +12.88 | +89 | +0 |
| Northern Parishes | 7,994 | 343 | 425 | +82 | 53.16 | +10.26 | +82 | +0 |
| Ropner | 11,662 | 1,700 | 1,777 | +77 | 152.38 | +6.60 | +77 | +0 |
| Ingleby Barwick South | 10,334 | 313 | 389 | +76 | 37.64 | +7.35 | +76 | +0 |
| Norton South | 8,899 | 1,184 | 1,253 | +69 | 140.80 | +7.75 | +80 | +11 |
| Billingham North | 7,841 | 449 | 516 | +67 | 65.81 | +8.54 | +67 | +0 |
| Billingham West & Wolviston | 3,959 | 216 | 266 | +50 | 67.19 | +12.63 | +50 | +0 |
| Hardwick & Salters Lane South West | 1,247 | 140 | 186 | +46 | 149.16 | +36.89 | +46 | +0 |
| Bishopsgarth & Elm Tree | 5,882 | 1,014 | 1,057 | +43 | 179.70 | +7.31 | +43 | +0 |
| Billingham South | 7,116 | 898 | 940 | +42 | 132.10 | +5.90 | +42 | +0 |
| Eaglescliffe East | 4,356 | 185 | 222 | +37 | 50.96 | +8.49 | +37 | +0 |
| Hardwick & Salters Lane West | 6,267 | 797 | 833 | +36 | 132.92 | +5.74 | +36 | +0 |
| Billingham Central | 8,278 | 1,041 | 1,063 | +22 | 128.41 | +2.66 | +22 | +0 |
| Hartburn | 7,716 | 412 | 433 | +21 | 56.12 | +2.72 | +21 | +0 |
| Norton North | 6,190 | 179 | 184 | +5 | 29.73 | +0.81 | +5 | +0 |
| Newtown | 4,493 | 1,013 | 1,015 | +2 | 225.91 | +0.45 | +2 | +0 |
| Fairfield | 10,357 | 545 | 525 | -20 | 50.69 | -1.93 | -20 | +0 |
| Southern Villages | 4,414 | 246 | 225 | -21 | 50.97 | -4.76 | +1076 | +1097 |
| Grangefield | 2,924 | 299 | 268 | -31 | 91.66 | -10.60 | -31 | +0 |
| Yarm | 8,646 | 550 | 510 | -40 | 58.99 | -4.63 | -40 | +0 |
| Norton Central | 6,183 | 807 | 762 | -45 | 123.24 | -7.28 | -45 | +0 |
Methodology and caveats
Neighbourhood Finder analysed its June 2026 authority export and the underlying police.uk street records for Stockton-on-Tees.
The comparison uses the same 28 neighbourhoods and displayed population of 199,966 at both endpoints. Rolling years cover July 2024–June 2025 and July 2025–June 2026. Counts and category totals were rebuilt from mart.crime_monthly; Cleveland Police has all 14 raw crime types present in all 24 source months.
For the resident-facing borough rate, NF excluded every raw record whose police.uk approximate location was On or near Prison from both rolling periods. This reduced the change from 3,968 to 2,860 reports and the rate increase from 19.8 to 14.3 per 1,000.
The adjustment is disclosed because police.uk warns that street locations are approximate and geocoding is not fully consistent. Independent inspectorate and monitoring-board evidence is incompatible with reading the raw prison-location step-change as a sudden increase in neighbourhood violence.
Mapped retail locations are also approximate and anonymised. They are used only to show concentration, not to identify an exact store or assign blame.
Public evidence is consistent with a mixture of changed offending, repeat offenders, fuller retailer reporting and stronger case-building. It does not allocate causal shares.
Public sources
- ONS: Crime in England and Wales, year ending March 2026
- Stockton Council Community Safety Select Committee report, 28 May 2026
- Cleveland Police neighbourhood patrol update, 20 January 2026
- Cleveland Police shoplifting charges, 9 February 2026
- HM Inspectorate of Prisons: HMP Kirklevington Grange
- Kirklevington Grange Independent Monitoring Board annual report 2025
- data.police.uk: About the data
Check your Stockton neighbourhood and compare nearby areas
Did your neighbourhood follow the borough retail pattern, or does its local evidence look different? Compare reported-crime indicators with prices and other daily-life factors before making a shortlist decision.
Downloads and reuse
Evidence downloads
Citation guidance
Full citation:
Neighbourhood Finder. (2026). Did Stockton's shoplifting rise shift beyond the town centre? (v1).
Short form:
Data: Neighbourhood Finder, Stockton shoplifting shift analysis (2026, v1).
Editorial reuse with attribution. Press contact: press@neighbourhoodfinder.co.uk